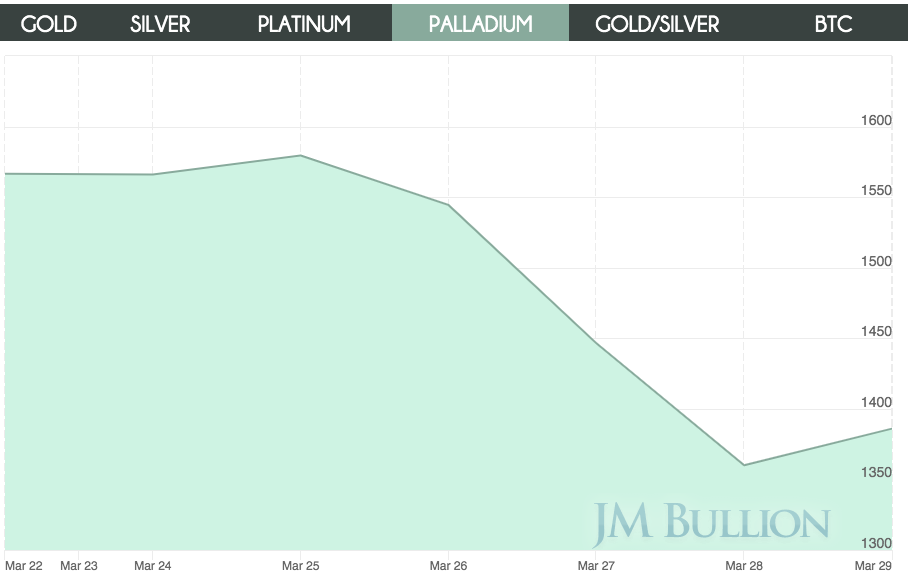
Palladium prices are getting hit hard today as the market trades lower by nearly $100/oz at $1,336. After hitting a new all-time high last week around $1,576/oz, the market has since provided some indications that a major top may have been reached.
The last two sessions have seen significant market volatility, and such volatile price behavior is common as markets make major tops or bottoms. Along with recent volatility has come a sharp rise in trading volume, another key clue about a potential top potentially being made. Having now given up over $200/oz in just a couple sessions, the market has also declined below the 50-day moving average. This average is commonly used by traders and investors as a way to gauge the market trend, and prices falling below the moving average are often used as a sell signal.
With prices now below this key moving average, it is likely only a matter of time before other longs are forced to liquidate their positions, adding to downside pressure. Some market participants may even begin to get short the market, further exacerbating the selling pressure.
What’s Behind the Selling?
There has not been any major bearish news behind the sharp move lower in the metal. Palladium has been in a sharp trend higher for some time and had more than tripled in value since 2016. Some analysts have suggested that the market had clearly reached bubble territory, and that bubble may now be in the process of bursting.
Others have suggested that the sharp declines are more a function of profit taking and position squaring as the first quarter comes to an end.
Recent strength in the dollar index could potentially be a factor. As a dollar-denominated commodity, a stronger greenback can weigh on the price of palladium as it makes the metal relatively more expensive for foreign buyers. Others have blamed the declines on worries over Chinese auto demand. As the globe’s largest auto market, slumping car sales in China could potentially be a factor behind the selling. Not only that, but the globe’s second-largest auto market, the U.S., is seeing an economic slowdown of its own that could put downside pressure on prices.
Outlook
The palladium market could very well have reached bubble territory and is now seeing a necessary and perhaps long-overdue correction. The long-term trend higher is still intact, although further selling could cause a major change in trend. The market’s behavior in the months and quarters ahead will likely be dictated by the state of the global economy, interest rates and other factors.
Despite the recent declines and potential for further downside, however, it has been suggested by some analysts that prices will still be higher in 2019 than the previous year.
Market Reaction
Palladium is down $70/oz in late am trade at $1,360/oz. The market has now shaved well over $200/oz from its price in the last two days and could see further downside before finding a bottom. Although it is not clear if last week’s highs were in fact a market top, several key factors make a convincing case. The next several days may provide more clues as the market could attempt to rally. Given the recent chart damage and deteriorating technical posture, however, any rallies in the market may be sold into aggressively.

Gold Price Chart


More articles from Matthew Bolden


