


Gold Price History
| AUD - Australian Dollars | 1 Year | 5 Year | 10 Year |
| CAD - Canadian Dollars | 1 Year | 5 Year | 10 Year |
| CHF - Swiss Francs | 1 Year | 5 Year | 10 Year |
| EUR - Euros | 1 Year | 5 Year | 10 Year |
| GBP - British Pounds | 1 Year | 5 Year | 10 Year |
| INR - Indian Rupees | 1 Year | 5 Year | 10 Year |
| JPY - Japanese Yen | 1 Year | 5 Year | 10 Year |
| USD - US Dollars | 1 Year | 5 Year | 10 Year |


View 30 Year Gold Price History
Economic History Resources - What was the price of gold then?
- U.S. Official Price for the years 1786 to 2001
- New York Market Price for the years 1791 to 1998
- Gold/Silver Price Ratio for the years 1687 to 1998
- London Market Price for the years 1718 to 2001
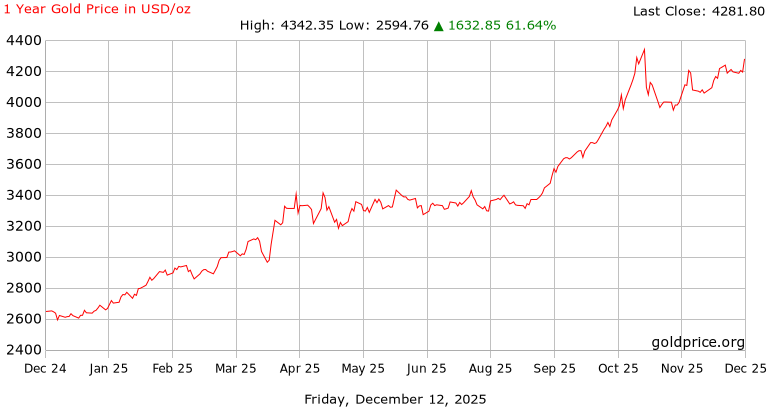
This page features a wealth of information on historical gold prices as well as gold price charts. If you are considering an investment in gold, you may want to take a look at the metal’s price history. The chart at the top of the page allows you to view historical gold prices going back over 40 years. You can view these gold prices in varying currencies as well, seeing how it has performed over a long period of time. Depending on the currencies being used, you may find a better long term value. For example, because gold is typically denominated in U.S. Dollars, if the dollar is weaker then someone buying gold in yen or euros may find gold to be relatively less expensive. On the other hand, a stronger dollar may make gold relatively more expensive in other currencies due to exchange rates.
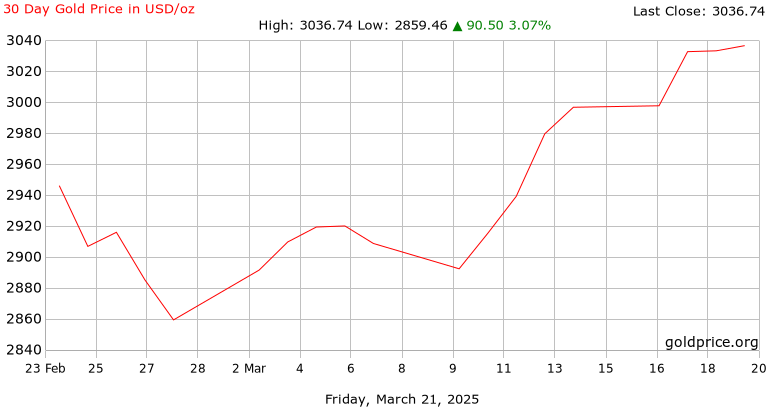
You can also easily examine historical gold prices on a much smaller time horizon from 10 minutes to three days to 30 days to 60 days and up. The timeframe you decide to look at may depend on your investment objectives. If you are simply looking to buy and sell gold as a swing trader, you may focus on the hourly or six hour charts. If you are looking to invest in gold for the long-term, you may be better off using longer timeframes such as weekly, monthly or yearly.
Why Look at Historical Gold Prices?
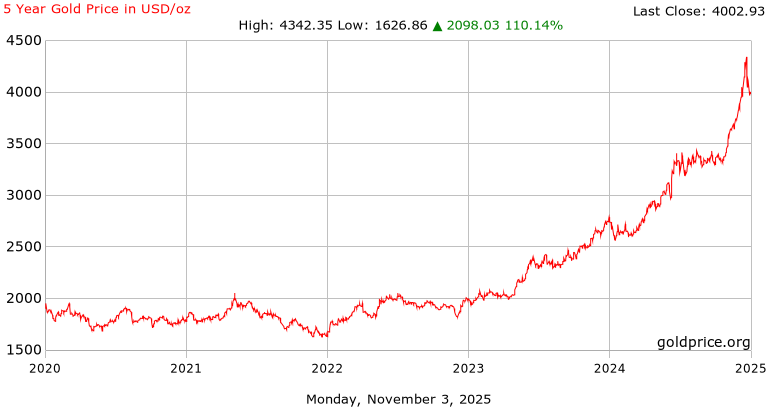
Looking at historical gold prices may potentially provide information that may assist in buying or selling decisions. Looking at the big picture, gold trended higher for many years before making all-time highs in 2011 of nearly $2000 per ounce. Gold has since been moving lower, but could have possibly found a bottom in 2016. Although it remains to be seen, gold’s declines from the 2011 highs could simply prove to be a pullback within an even longer-term uptrend.
Examining historical gold prices can potentially be useful in trying to identify potential areas of price support to buy at. For example, if gold has pulled back to $1200 per ounce on numerous occasions but is met with heavy buying interest each time, then the $1200 area could be considered a level of support and could potentially be a good area to try to buy at.
In addition to viewing historical gold price charts in U.S. Dollars, you can also view historical gold prices in numerous alternative currencies such as British Pounds, Euros or Swiss Francs. You can even view a historical inflation-adjusted gold price chart using the 1980 CPI formula.
For easy reference, this page also contains a simple table that provides gold’s price change and percentage change using a single day, 30 day, six month, one year, five year and 16 year timeframes.
What has Driven Changes in the Gold Price?
Over the past several decades, the price of gold has been influenced by many different factors. Gold’s price history has seen some significant ups and downs, and dramatic changes in price may be fueled by such issues as central bank buying, inflation, geopolitics, monetary policy equity markets and more.
One of the biggest drivers of gold is currency values. Because gold is denominated in dollars, the greenback can have a significant impact on the price of gold. A weaker dollar makes gold relatively less expensive for foreign buyers, and thus may lift prices. On the other hand, a stronger dollar makes gold relatively more expensive for foreign buyers, thus possibly depressing prices. Fiat, or paper currencies, have a tendency to lose value over time. If this continues to be the case, gold could potentially continue in an uptrend as investors look to it for its perceived safety and its potential as a hedge against declining currency values. Gold has long been considered a reliable store of wealth and value, and that reputation is not likely to change any time soon.
Although past performance is not necessarily indicative of future results, gold’s price history can potentially provide clues as to where it could be headed. Looking at past price data, for example, may help with spotting uptrends or downtrends. Investors may also potentially spot tradable patterns within the price data that can potentially lead to solid buying or selling opportunities.

