Happy Friday, traders. Welcome to our weekly market wrap, where we look back at these last five trading days with a focus on the market news, economic data, and headlines that had the most impact on gold prices and other key correlated assets—and may continue to into the future.
Gold prices on Friday are all but certain to wrap up the first week of notable decline after a strongly positive performance in recent months.
So, what kind of week has it been?
As expected, the gold market’s path this week has been determined much more by headline-flow around the US debt ceiling negotiations (and, here at the tail end of the week, FOMC rate-path projections) than by macroeconomic data flow. This is owed to both the urgency of the debt ceiling talks, the market implications of prolonged gridlock, and a relatively sparse data calendar. What we were admittedly caught a little off-side by was just how negatively gold prices would react to the slow-but-steady stream of reports relating to the budget talks between the US executive and legislative leaders.
Monday’s gold trading appeared to revolve around investors and managers positioning themselves for the week of negotiations and possible headlines, which pulled the yellow metal steadily lower through the day, although, for the first session of the week, at least, the support that had been consolidating for gold spot at $2,000/oz seemed like a reliable circuit-breaker. Tuesday’s Retail Sales report for April, the highest profile on this week’s economic calendar, was expected to be another negative input for gold, assuming that any print near to the expectations for a rebound in retail growth would be read as another wave-on for the Fed to continue hiking rates, even next month, should they feel the need. The reported headline number for Retail Sales growth in April missed below the consensus projection (+0.4% MoM, vs. +0.8%) moderately but still showed an important rebound as compared to the previous month’s contraction. After an acute risk-off jump in gold prices that lifted the precious metal back above $2010 briefly, gold prices did, in fact, wither away as investors digested the report. Not long after markets opened on that same morning, reporting on the debt ceiling talks began to flow. The headlines started out mixed at best, but by mid-morning, they had started to skew at least modestly optimistic, and this dynamic really increased the pressure on gold prices, allowing the chart to cut relatively smoothly below prior support at the key $2000/oz level.
The outflows from gold slowed by Tuesday evening with spot prices around $1990, and Wednesday’s trading was much less volatile thanks to a lack of any novel reporting on the US debt situation, but the yellow metal did shed another $10/oz as it appeared to be drained by a combination of more recent gold-longs closing out their losses and older positions possibly being closed-out to take some profit before another dip.
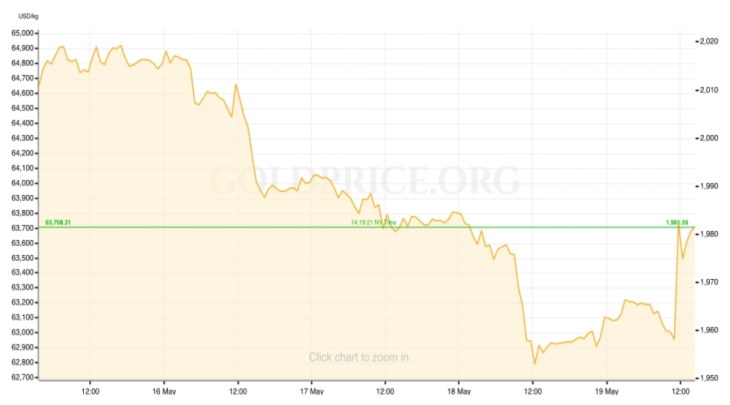
On Thursday, per reporting, the framework of a “last-minute” debt ceiling deal was starting to come together. This narrative acceleration yanked the floor out from under gold prices again, sending the metal on a drop that wouldn’t find a solid floor until lunchtime, just above $1950/oz and a seven-week low for gold bids. With the favor of some hindsight, the dynamic that applied such a heavy headwind to gold seems to have been as follows: the acute, unwanted additional tightening of financial conditions that would be created by the first default of US Treasury debt since the 1970s would be projected to kick-off a full-blown US recession nearly immediately and, as such, force the Fed to not only pause rate hikes but to provide relief and support in the form of rate-cuts in short order; as a counterpoint, then, the flush of reporting that debt talks are getting somewhere seems to have been interpreted by the market as another signal—similar to that from Tuesday’s Retail Sales date, but stronger—that the FOMC is under less pressure to move towards a pause and eventual rate cuts faster than is their stated plan. So, although US stocks began a decent rally that has continued through Friday, in most other major asset classes that we track closely, we saw a similar reaction to everything else that’s come as some version of a more hawkish Fed input over the last 12 months: gold prices fell as the Dollar pumped higher with momentum, and yields on the US 10-year Note climbed well clear of +3.6%.
Out of pattern for this phase of the hiking cycle, a public appearance by Fed Chair Jerome Powell on Friday morning has provided some relief to gold, after three consecutive days of losses. At a monetary policy gathering in DC, Powell gave more explicit wording—from the horse’s mouth—to a thought that has been kicking around since March; that the implicit tightening created by banks stepping back from lending in the wake of the collapse of SVB and other “smaller” banks may lessen the degree to which the Fed will need to raise policy rates in order to further slow the economy in the effort to rein in inflation. This has unwound some of the impacts of Thursday’s market moves, explicitly for gold prices which have climbed steadily higher on Friday and look to close the week closer to $1980/oz, which would be an erasure of the losses since Wednesday night.
The question heading into next week’s open will be which narrative comes out on top in the push-and-pull and, as the dominant driver of market sentiment, will point towards a continued rebound for gold or a resumption of the slide farther away from regaining $2000.
For now, traders, I hope you can get out and safely enjoy your weekend for the next couple of days. After that, I’ll see everyone back here next week.

Gold Price Chart


More articles from Matthew Bolden


