January PPI shrank -0.01%, missing expectations of a 0.01% monthly increase as producer prices fell due to reduced demand for goods according to the US Bureau of Labor Statistics.
Key Takeaways
- The decline in the final demand index can be traced to a -0.8% decrease in prices for final demand goods.
- Demand for services, on the other hand, increased by 0.3%.
- The index for final demand less foods, energy, and trade services rose 0.2% in January after no change in December.
- Annual PPI is now 2% compared to 2.5% in December.
The drop in the final demand goods index was the largest since a 1.2% decrease in September 2015. The decline is mostly due to a dip in demand for energy which slid down 3.8% and accounted for 3 quarters of the drop. Gasoline prices dropped by 7.3%.
The index for final demand foods fell 1.7%, and prices for final demand goods excluding the volatile elements of food and energy actually climbed 0.3%.
The indexes for fresh and dry vegetables, fresh fruits and melons, basic organic chemicals, jet fuel, and diesel fuel all moved lower, while prices for construction machinery and equipment jumped 1.7%.
The index for final demand services jumped 0.3% after no change in January. 80% of the rise is due to demand for trade services which rose 0.8%. The index for final demand services less trade, warehousing, and transportation was unchanged. Service demand also rose due to margins for apparel, jewelry, footwear, and accessories retailing which rose.
Disappointing US data sends #USD lower - retail sales unexpectedly fell 1.2% m/m vs. a small rise expected with core sales dropping even more sharply by 1.8%, likewise easily disappointing expectations. Meanwhile PPI unexpectedly dipped 0.1% m/m but core PPI rose 0.3% ^FR
— FOREX.com (@FOREXcom) February 14, 2019
Market Reaction
The USD has dropped in value and gold prices have jumped accordingly following the report with a gain of 0.31%, last trading in the top end of the range $1,311.02/oz with a high of $1,312.37/oz and a low of $1,303.51/oz.
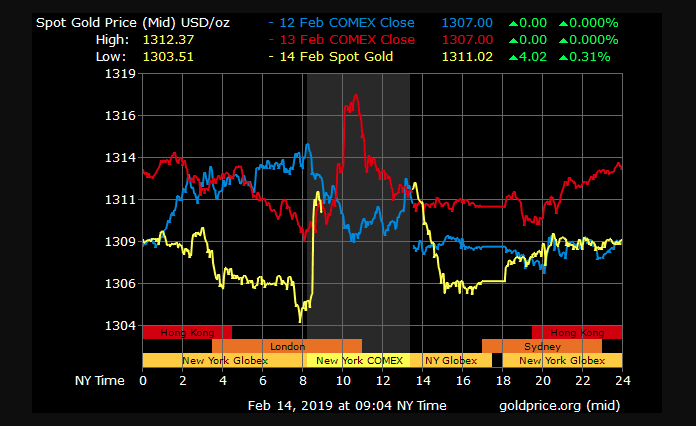

Gold Price Chart


More articles from Conor Maloney


