Happy Friday, traders. Welcome to our weekly market wrap, where we take a look back at these last five trading days with a focus on the market news, economic data and headlines that had the most impact on gold prices—and may continue to into the future—as well as the charts for silver, the US Dollar and other key correlated assets.
At the close of another mild week that ended up with a bang of volatility, gold prices have been pressed into a loss for the final trading week of October. While the yellow metal is undeniably on the back foot on Friday thanks to a resurgent US Dollar, the recent floor of support remains reliable ahead of a big FOMC meeting in the days ahead.
So, what kind of week has it been?
Repeating what has become a common pattern since the summer, a light macroeconomic calendar this week set the backdrop for a somewhat calm run for gold prices through Wednesday before some Thursday/Friday volatility defined the yellow metal’s results for the week. The trend will most likely be broken with next week’s long-scrutinized FOMC meeting on Wednesday, but it still gives us some useful input on what ranges gold prices might be bound to ahead of Fed Day.
The initial “advance” reading of the US economy’s growth in Q3 was left out of Monday’s preview piece because the data point was not expected to impact gold prices in a meaningful way. This proved to be a largely correct assumption on the day. Even with a disappointing headline number (+2% growth vs. expectations of roughly +2.7% QoQ,) gold prices endured some choppy trading initially but ultimately toed a steady line just above $1800/oz through Thursday’s trading session. (In the days prior, gold had recovered from a Tuesday sell-off, thanks in part to weakening US Treasury yields.)
While gold price was relatively inert, as expected, following the GDP print, correlated assets for the yellow metal were more effected: Treasury yields remained subdued until a Thursday night rally, and the US Dollar’s recent bull run was dented by a sharp drop in DXY from which the Greenback did not immediately recover.
That gold prices didn’t make much of a shift higher under these conditions might tell us something about a lack of headroom (or interest) for spot prices to rally ahead the Fed’s expected commencement of the taper following Wednesday’s FOMC meeting; Or, possibly, continuing into the end of the year. It seems reasonable to expect that any acute spike in gold’s chart to retake $1800/oz or higher would lack the support of buyers.
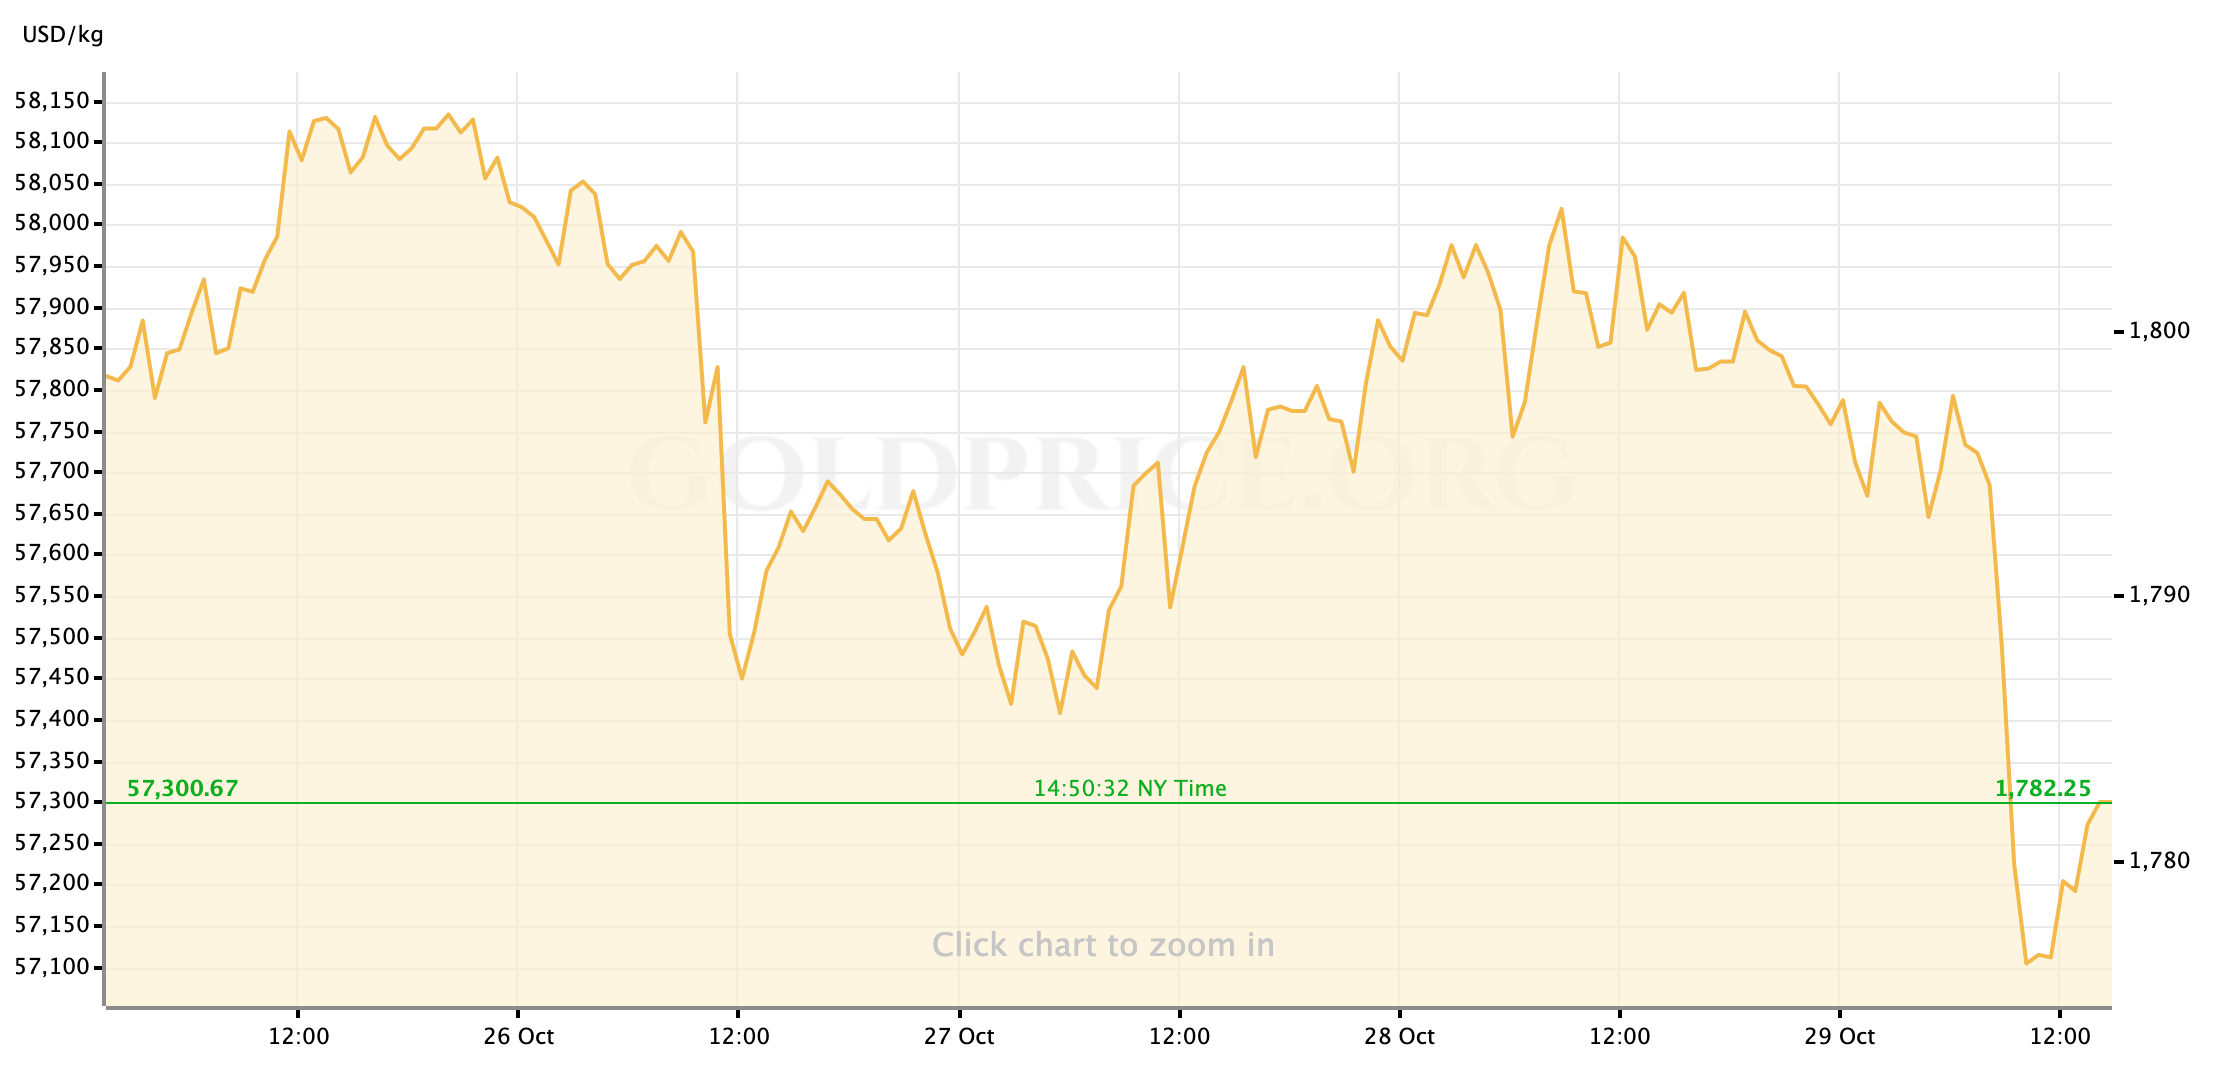
Getting back to the week ending today: Gold was much more susceptible to broader market moves on Friday morning. Prices had already slipped back below $1800 during the European trading session as London’s positioning pre-Fed Week included general selling in US Treasuries that lifted yields again. Then, at the same time as the Fed’s in-house estimation of US inflation printed on Friday morning, the US Dollar put in a rally that dominated most other major assets: most major commodities fell relative to the Dollar, and each of the benchmark US equity indexes began their sessions in the red. Not to be left out of the Dollar’s destructive rally, gold spot prices dropped as low as $1775/oz before finding reliable support.
Given the timing, it’s tempting to chalk these moves up to the PCE Index data (which has allowed headline writers to talk about “new” high levels of inflation despite not showing any truly dramatic acceleration,) but it’s more likely the severity of the moves, in the Dollar especially, is more about what’s coming from the Fed than Friday’s data.
The surging US Dollar (and the rising Treasury yields we’ve seen since late Thursday evening) is consistent with expectations for the FOMC to kick-off the tapering of monetary support next week, which investors tend to interpret as just the first step towards a regime of higher interest rates in the US—an environment in which Dollar will generally be more valuable. Once the Dollar got a moderate lift from Friday morning’s inflation data, investors likely piled into the Greenback ahead of next week’s announcement (which is really only a formality, as the move has been anticipated to one degree or another for several weeks.)
With the market in this kind of stance to wrap the week, support for gold spot prices seems reliable enough somewhere around $1780/oz and there may be room from Monday for the yellow metal to retake some territory between there and $1800. But it’s difficult to imagine a strong enough shift in sentiment (or fundamentals) to push gold prices beyond what currently a hearty line of resistance. What happens post-FOMC is less clear, especially with the October Jobs Report due just two days later. From there, depending on what other guidance we do (or do not) get from the Fed, gold prices may have less limiting sensitivities to the US Dollar or Treasury yields.
For now, traders, I hope you can get out and safely enjoy your weekend for the next couple of days. After that, I’ll see everyone back here on Monday for our preview of the week ahead.

Gold Price Chart


More articles from John Moncrief


