Good morning, traders. Welcome back to our weekly preview of the trading days ahead, with a specific focus on the economic data, as well as global and market narratives that could have the most impact on gold prices, the Dollar, and other correlated assets.
Gold prices have collapsed following a sharp spike higher at the start of trading Sunday evening. The initial gap higher was driven by another surprise move by the US Federal Reserve, which cut rates by an astonishing full percentage point so that short term interest rates are back to the lower boundary. Additionally, the FOMC announced $700 billion in new bond purchases aimed at supporting the US economy currently in a near freeze as the country comes together to battle the spread of Covid-19.
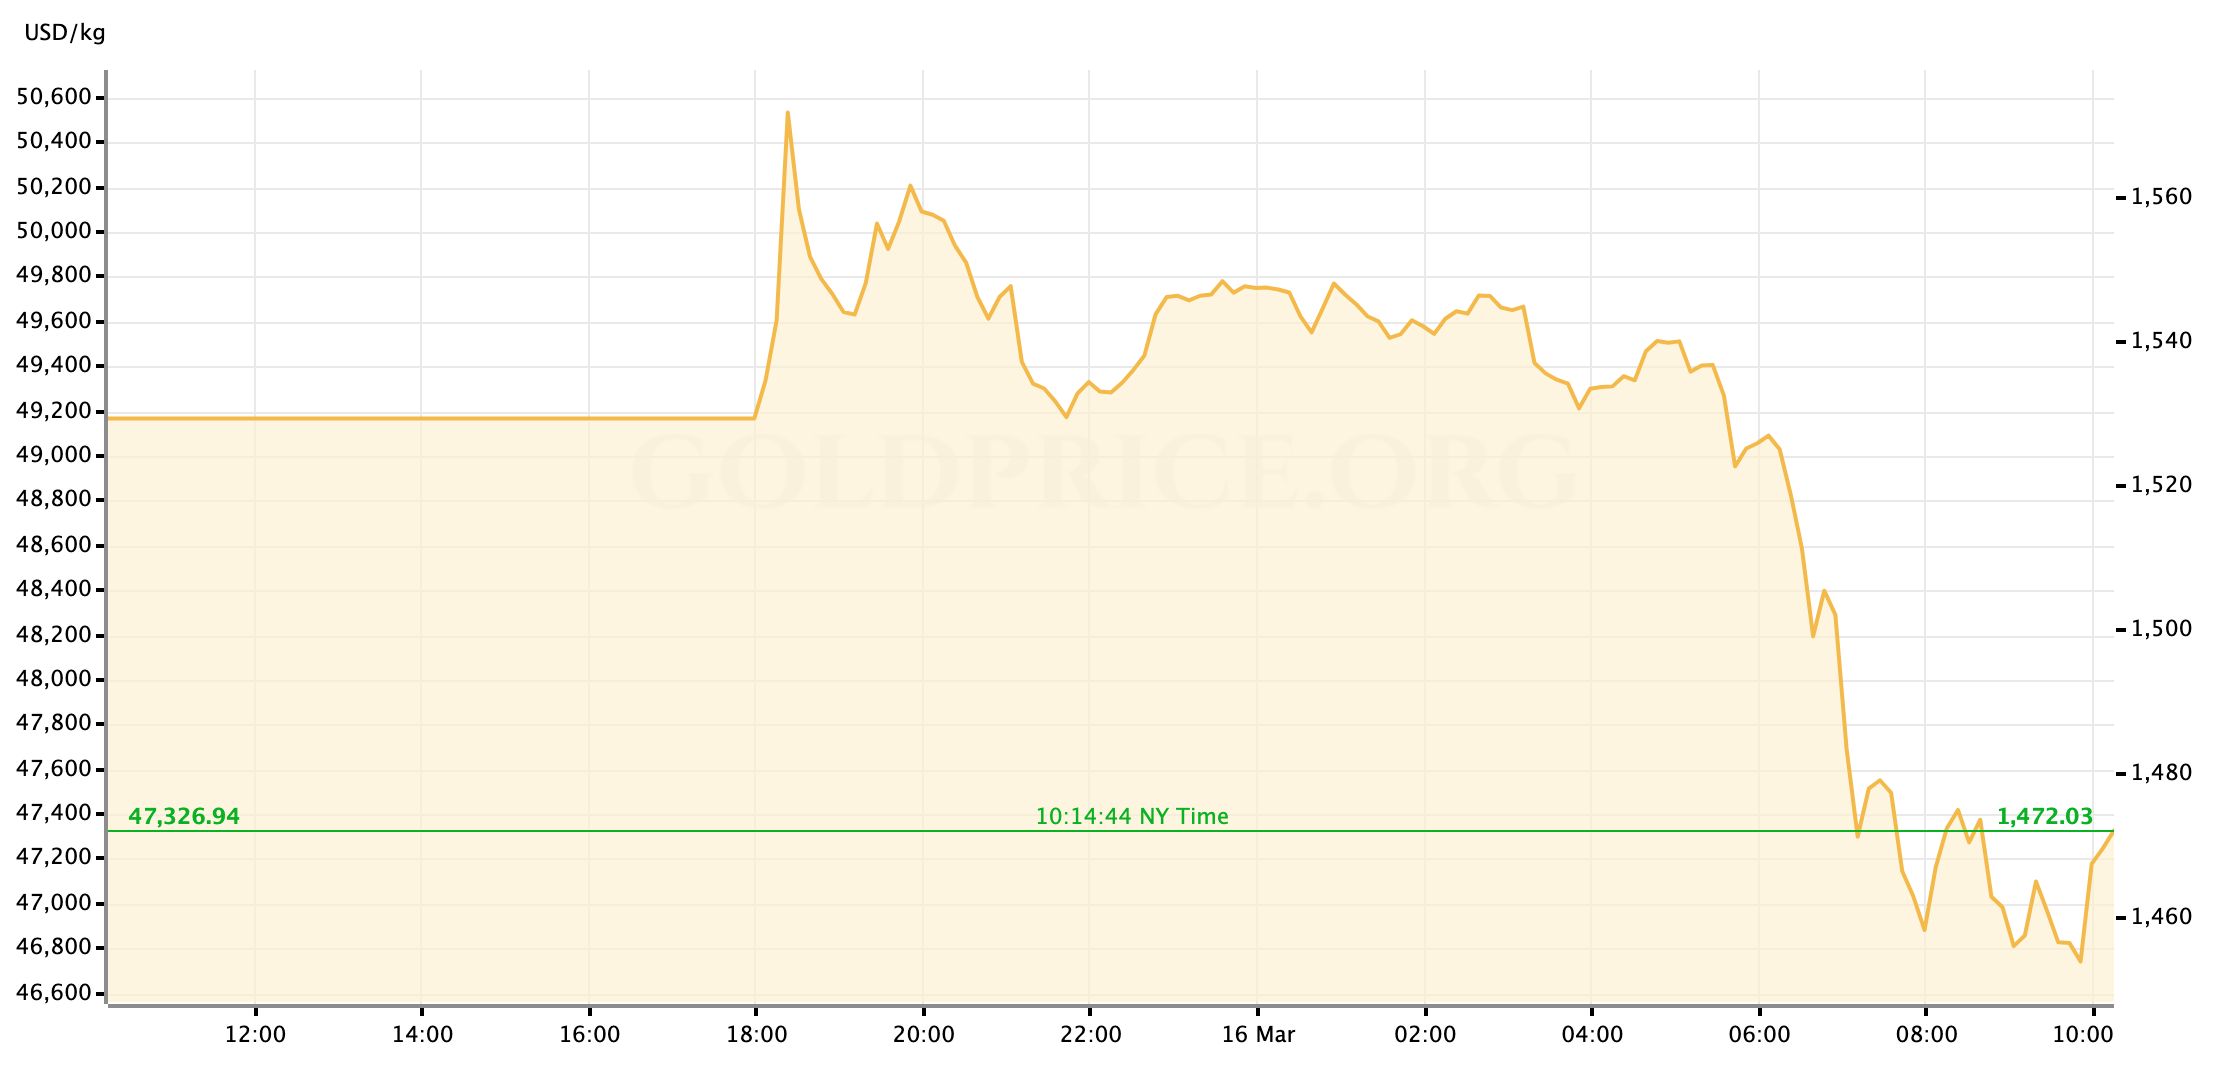
As we’ve seen with the Fed’s previous efforts at emergency support, the lift in asset prices including gold was short lived. The fear of course is that the Fed’s monetary policy measures will still be too little without a stronger push of fiscal stimulus from the government to match it. While most of the overnight session saw gold prices trading at only minimal gains from Friday’s close, as US trading machinery spun up early this morning that fear became the dominant force in market positioning: US stock futures once again traded to limit lows, while the pressure to “sell what you can” continued to press the gold prices lower with considerable force. The yellow metal fell through $1500/oz.
US stock markets have opened for trading, and for the third time in a week the immediate selling pressure has triggered the first of the built-in circuit breakers and temporarily halted trading.
U.S. trading resumes with more losses for stocks, S&P 500 Index drops 10%, Dow Jones Industrial Average posts biggest drop since 1987 crash https://t.co/Pe92THjKWr pic.twitter.com/Lfnvi2Yx16
— Bloomberg Markets (@markets) March 16, 2020
At the time of writing, with some buyers meekly rising after the market open, gold spot is trading near $1465. With gold off more than $100/oz from the Sunday night peak, we’ll watch this week to see if markets over all are closer to finding the bottom and—if they are—what the means directionally for gold prices.
The Fed’s emergency measures last night act as a replacement for this week’s scheduled FOMC meeting, so the economic calendar gets a bit lighter for the week and allows us to focus more on how the roiling global stock markets may influence metal prices. With that in mind, let’s take a look at the week.
US Economic Data to Watch
Monday, March 16 at 8:30am EDT // NY State Empire Manufacturing Index (Mar)
[consensus expectation: +4.9 // previous: +12.9]
[actual: -21.50]
This morning’s Empire State read has given us our first look at the pressure that the Covid-19 health crisis is putting on the American industrial sector. With US stock markets not yet open and gold prices having already fallen through the floor earlier in the morning there has been very little in the way of market reaction to the New York Fed’s ugly data set.
Tuesday, March 17 at 8:30am EDT // Retail Sales (Feb)
[(headline) consensus exp.: +0.2% MoM // prev.: +0.3%]
[(core) consensus exp.: +0.4% MoM // prev.: flat]
The marked drop in gas prices (even before the OPEC/Russia trade conflict escalating) is expected to hold overall US Retail Sales to minimal growth in February. While analysts are looking for a stronger pulse in the “core” number (ex. gas, autos, and building materials,) that’s expected to be driven by the first rushes of consumer stockpiling in groceries and dry goods so I’m not sure that the month-over-month increase will be taken as “good news.” I do think that retail numbers could actually impact risk appetite more than industrial data for this week, given the importance of the US consumer to any continuation of our economic expansion. That said, it’s difficult to say from what that reaction would look like in Dollar and gold price trade-flow.
Tuesday, March 17 at 9:15am EDT // Industrial Production (Feb)
[consensus exp.: +0.4% MoM // prev.: -0.3%]
In light of this morning’s ugly miss on the Empire State Manufacturing data, even though we’re looking at different calendar months, I suspect analysts may take the time to revise their estimated lower for IP. Either way, we’ve seen from this morning’s data that the flight from risk is happening at such a speed that we can consider most manufacturing data “priced in” for now so I don’t expect much market sensitivity here.
Wednesday, March 18 at 8:30am EDT // Housing Starts (Feb)
[consensus exp.: -4.2% MoM // prev.: -3.6%]
It’s the effect of actual weather, rather than the pervasive economic storm that we’re facing, that is expected to show the number of new housing builds decrease from the month prior. Market reaction this time should be minimal.
Thursday, March 19 at 8:30am EDT // Philadelphia Fed Manufacturing Index (Mar)
[consensus exp.: +10.0 // prev.: +36.7]
Given what we saw from New York this morning, the projection for the Philly Fed data on Thursday seems more appropriate; although, the expected results are only a steep drop in relations to February’s blockbuster data, so there may still be room for this to surprise to the downside even further and go negative. As I pointed out before, the immediate market is likely to have little-to-no meaningful reaction to more ugly numbers this week. But the trend of this data will continue to matter for us in forming our outlook around rates and gold prices in the months to come, so it still has value to us as long-term traders and investors.
Thursday, March 19 at 8:30am EDT // Initial Jobless Claims
[consensus exp.: +219k // prev.: +211k]
Analysts are still expecting jobless claims to remain flat to the trend this week but be aware that with the pervasive cooling on economic activity created by Americans’ efforts at responsible “social distancing,” we’re likely to see more fearful market reactions if/when this number starts pushing higher.
Friday, March 20 at 10am EDT // Existing Home Sales (Feb)
[consensus exp.: +0.7% MoM // prev.: -1.3%]
Mid-morning on Friday seems like it’s about three years from right now, so it’s difficult to anticipate the market mood at the time of this tepid end to the week’s data calendar. Most likely, traders and investors will file this one away for revising 2020 outlooks and we’ll have very little market reaction on the day.
And that’s how the week looks in front of us, traders; no first tier European or Asian data to cover this week so I don’t want to waste your time on it with all that’s going on. I wish you the very best of luck in your markets this week as always, and I’ll see everyone back here on Friday for our weekly market wrap.

Gold Price Chart


More articles from John Moncrief


