Happy Friday, traders, and welcome back to our regular market wrap for this (holiday shortened week. As usual here, we’ll be focusing on the data and market news that mean the most for gold prices, as well as silver, the US Dollar, and other key correlated assets.
The last 3+ trading days have been relatively volatile for a lot of major asset classes; primarily for US stocks, but also for gold. The yellow metal looks to lose the week out with a steady gain of $10-15/oz from the Sunday evening’s opening bids while silver has looked strong closer to $27 than $26.
So, what kind of week has it been?
Tuesday: Gold Prices Rebounded from a Holiday Low as Equities Dropped Again
The flow of market relevant news and data on Tuesday coming out of the Labor Day pause was, at best, a trickle, but assets price charts remained somewhat energetic. Our weekly preview piece was published just before US stock markets opened for cash trading and signaled the low tick for gold prices this week, when spot was selling somewhat below $1920/oz.
American stock markets took a hit for a third day running on Tuesday, with flailing tech stocks—a sinking price for Tesla shares grabbing the headlines this time around—once again leading the way lower as volatility continued to surge. From the start of equity markets’ bad day, gold prices rode a strong safe-haven bid from the lows. As investors’ level of concern grew about a longer lasting correction following the summer’s unstoppable market gains, the yellow metal picked up as much as $20/oz in spot values before meeting some afternoon resistance and settling above $1930/oz. Silver continued to hold strength above $26 spot. As the US session drew to a close, the S&P and Dow Jones Industrial indices were both off more than 2% while the tech stock heavy NASDAQ closed more than 4% lower.
Wednesday: Safety Seekers Weren’t Fooled by a Bounce in Equities and Gold Held the Line
As markets turned the page onto Wednesday, investors and money managers got at least a brief reprieve from the down-and-to-the-right trend from the previous sessions. Seemingly driven by cash-holders stepping in to buy the dip, the major US stock indices made their biggest climbs since June.
Despite the rally in risk assets, the gold chart for Wednesday’s US session was a close match for the day before. While the yellow metal again sank to the day’s lows in the pre-market hours, prices climbed sharply through the morning even as stocks market strengthened, and in the afternoon settled just below $1950/oz. The US Dollar’s value fell on the day which aided in gold’s rise, as did a general reach for value across all markets. Also supporting some safe havens like gold, in my opinion, was a general level of doubt in the market about whether the recent downward correction had actually finished.
Thursday: Warning Sounds from the Labor Market Roiled Stocks Again and Supported Precious Metals
The surprising level of market volatility for a truncated week continued through Thursday. Gold prices made a leap to their weekly highs (with spot prices selling above $1965/oz, briefly) in the morning hour stateside. The rally in gold prices was boosted this time by concerns about initial jobless claims data for the week remaining flat rather than continuing to decline as most had hoped.
Initial jobless claims unchanged from prior week at 884k vs. 850k est.; continuing claims up to 13.39m vs. 12.9m est. & 13.29m in prior week … greatest increases in CA (+22.6k), TX (+4.5k) & LA (+3.7k); greatest decreases in FL (-6.1k), GA (-5.5k) & PA (-2.6k) pic.twitter.com/OdMKnTqdoY
— Liz Ann Sonders (@LizAnnSonders) September 10, 2020
The stubborn print has had some analysts concerned about shakiness just beneath the surface of the US labor market’s recover from the spring collapse. Risk-off positions were a winner in the morning, and for most of the day, as the Dollar rose and gold made its highs. The yellow metal’s chart saw a strong pullback mid-morning though, as some investors preferred the safety of the US Dollar while other perhaps thought the morning’s gold rally was a little over-extended.
Speaking of over-extended (look at that, what a segue, the boy still got it,) US equity markets continued to exhibit serious concerns that five months of nothing-but-up amid a global pandemic has left stock prices too far out over their skis. Pulled lower again by faltering a faltering technology sector, all major US indices fell on Thursday.
Friday: Markets are Calming Following an Encouraging Inflation Read, Gold Consolidates Gains
This morning’s consumer inflation read was really the only top tier economic data on our slate for the week. The headline number was expected to accelerate slightly while the “core” calculation would maintain its course from July; in practice, both numbers printed slightly above expectations. It is, speaking very broadly, a positive sign for the US economy’s path back to health.
U.S. consumer prices rose for a third month in August, signaling a gradual pickup in inflation as the economy recovers https://t.co/YE9UzGldag
— Bloomberg Economics (@economics) September 11, 2020
Gold prices were up on the news, possibly as a result of the traditional perception of gold as a primary inflation hedge, although it’s obvious we’re quite far away from that accelerating into a growing concern. Spot prices reached as high as $1955/oz in morning trading, alongside a brief attempt by spot silver to break above $27. The brief rally was slowed by US equities opening with a pop and drawing some level of investor appetite into risk-on positioning.
Since that initial pop, US stocks have settled and look relatively calm to close the week in a flat-to-higher trajectory, contrasting the whipsaw sessions that defined this week’s trading. Gold’s chart has also calmed for the day, marching steadily along a line of $1950/oz as we head into the weekend.
Next Up
Looking ahead to next week, the main economic focus will be Wednesday’s FOMC statement and press conference. In the headlines, it looks like we could be headed for another ratchet higher in US-China trade tensions, and the fact that an already ineffectual US Congress seems to be getting farther away from passing a new economic stimulus bill may continue putting pressure on stocks and other risk-sensitive assets.
For now, get out there and enjoy your weekend, traders. I’ll see you all back here on Monday for our regular preview of the trading days ahead.

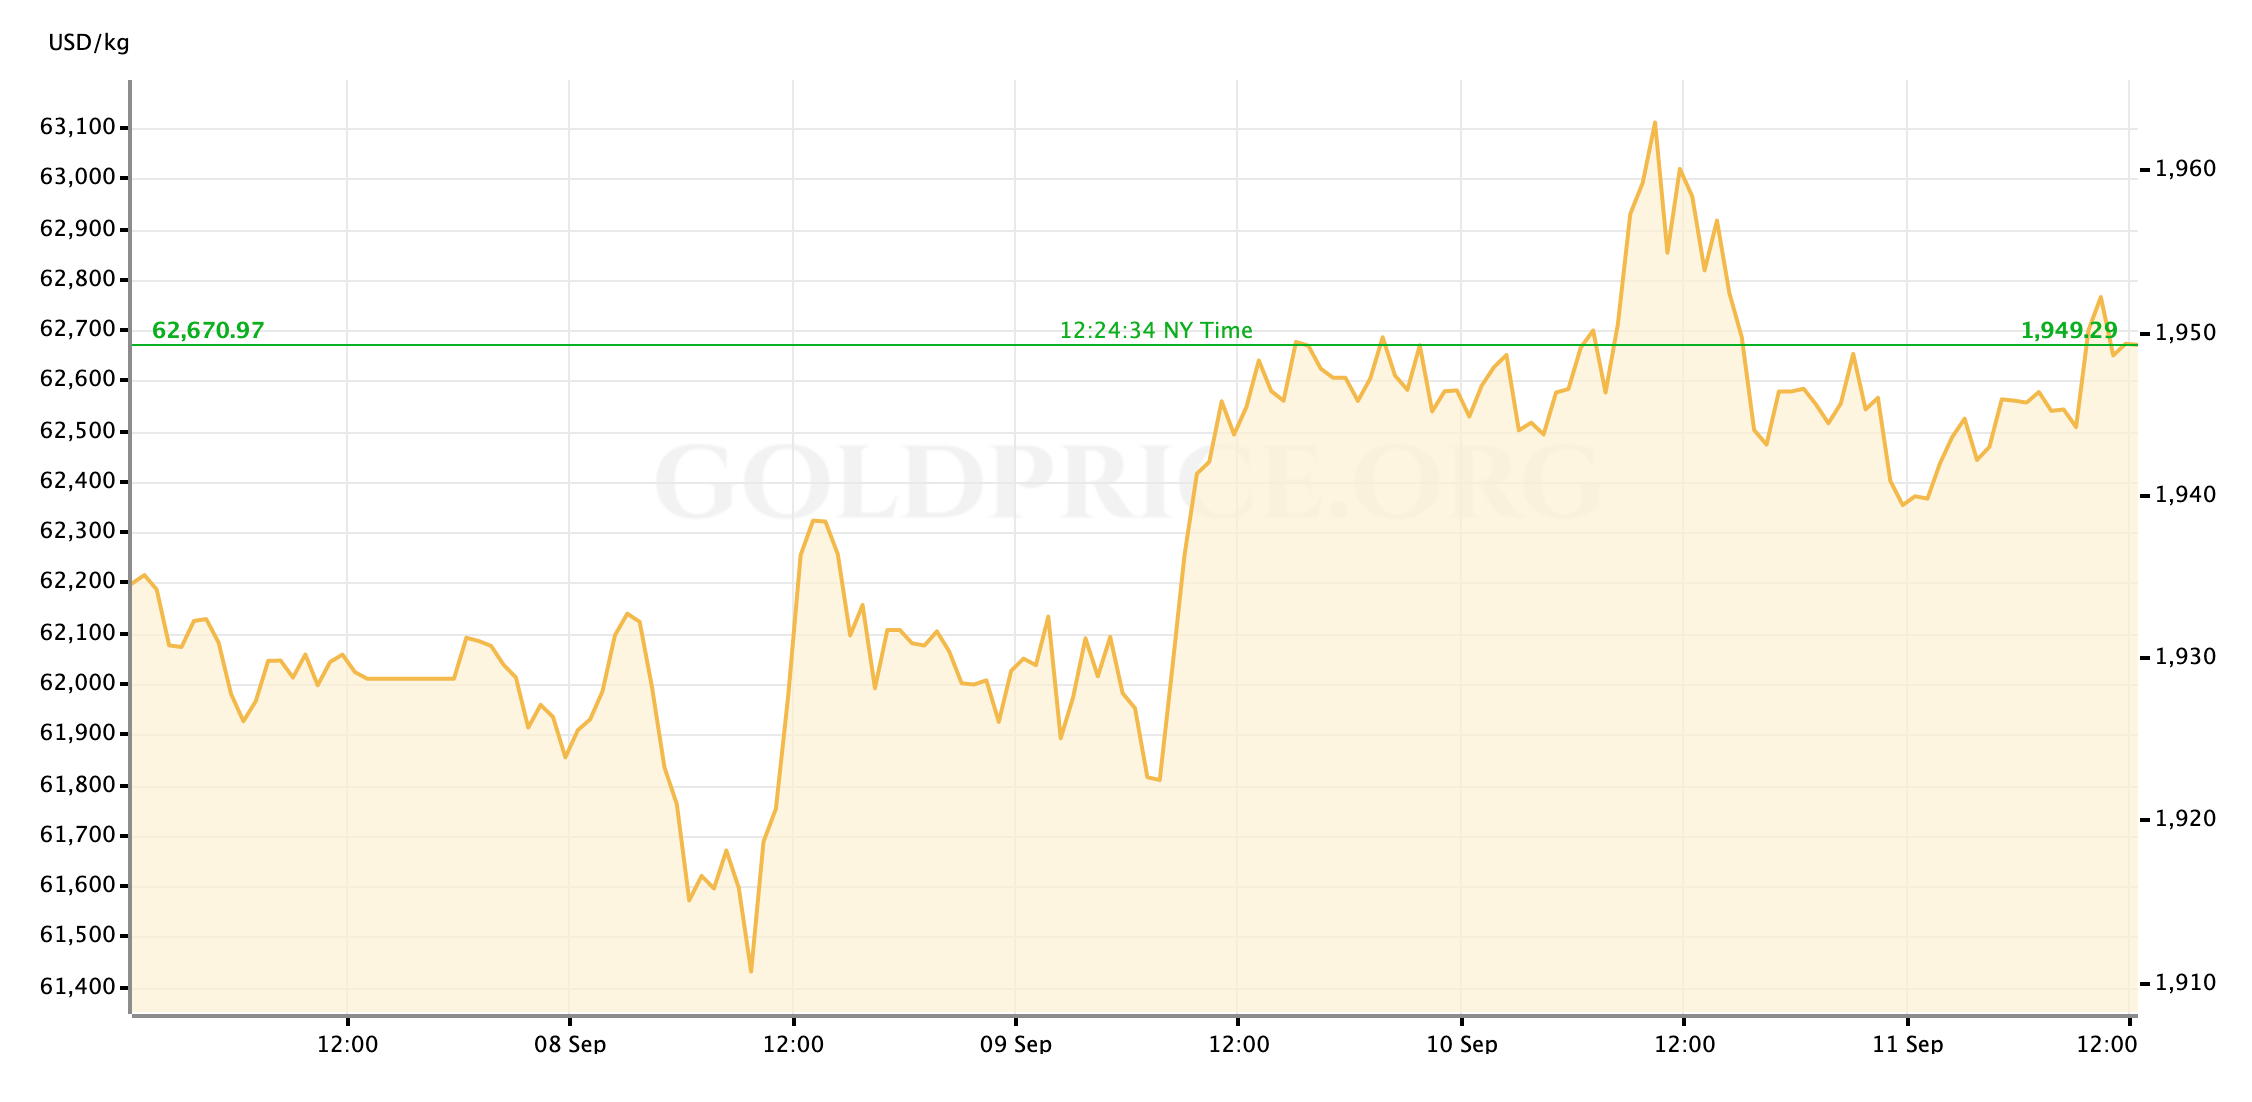
Gold Price Chart


More articles from John Moncrief


