The housing market continues to show signs of weakness with the latest report revealing a decrease in home sales for the month of April. Home sales have now declined for 14 months in a row.
Key Takeaways
- Sales of US existing homes dropped by 0.4% in April, in sharp contrast to the expected gain of 2.7%.
- Sales have declined for 14 consecutive months, with the prior month registering a 4.9% drop in sales.
- Mortgage rates have dropped considerably in recent times, but the housing market is still suffering from high prices and tight supply.
The National Association of Realtors released a report on Tuesday pointing to ongoing difficulties in the housing market. The latest monthly result is 4.4% lower than the numbers seen in April 2018.
5.19 million units were sold in April with a sharp drop in 30-year fixed mortgage interest rates in March having little effect. The drop in rates had influenced market analysts to predict a gain in housing sales for the first time in over a year, but this has yet to materialize.
The inventory of existing homes for sale rose 1.83 million in April, up 1.7% on the year to a supply of 4.2 months. Homes spent an average of 24 days on the market in April, down from 36 days the month prior and from 26 days this time last year. Over half of the homes sold in April were on the market for less than a month.
The median price for an existing family home, including single-family homes, was $267,300, up 3.6% annually. Prices have been gaining for 86 months in a row, although the gains have been shrinking since last summer following new inventory entering the market at that time. However, the years of price gains have left their mark, with property in major cities considered unaffordable for many would-be buyers.
Regional Data
In the Northeast, sales fell 4.5% to an annual rate of 640,000. The median price in the region rose 0.9% annually to $277,700. Midwestern sales came in at 1.17 million units, 7.9% below April 2018 levels. The median price rose 5.5% annually to $210,500.
The South, where the majority of homes are sold, saw a -0.4% drop to 2.27 million units, down 1.7% from last year. The median price was $236,800, up 4.4% from last year. Finally, existing home sales in the West rose 1.8% to 1.11 million units in April, a -5.9% decrease compared to this time last year. The median price was $395,100, up 1.3% annually.
Another disappointment as existing home sales unexpectedly fell to a 5.19 mm unit pace in April. Sales are off 4.4% Y/Y and inventories at 4.2 months’ supply (up 1.7% Y/Y). This is a good indicator for architectural #coatings sales. pic.twitter.com/EsSGFgL1LI
— Dr Thomas Kevin Swift (@DrTKSwift) May 21, 2019
Expert Outlook
“First, we are seeing historically low mortgage rates combined with a pent-up demand to buy, so buyers will look to take advantage of these conditions,” said NAR’s Lawrence Yun. “Also, job creation is improving, causing wage growth to align with home price growth, which helps affordability and will help spur more home sales.”
“We see that the inventory totals have steadily improved, and will provide more choices for those looking to buy a home,” Yun said, adding that sellers have to realize that price growth has moderated. “When placing their home on the market, home sellers need to be very realistic and aware of the current conditions.”
“Our outlook for the housing market remains largely unchanged,” wrote Sam Khater, Freddie Mac’s chief economist, in a monthly report. “We still expect stronger home sales and housing starts in the coming months due to favorable market conditions and accelerating wage growth.”
Market Reaction
Gold has ticked downward following the news and spot gold last traded at $1,272.78/oz, down 0.26% on the day with a high of $1,278.45/oz and a low of $1,269.77/oz. Gold was been under selling pressure from earlier in the session, and it’s possible that the weak housing data alleviated that somewhat.
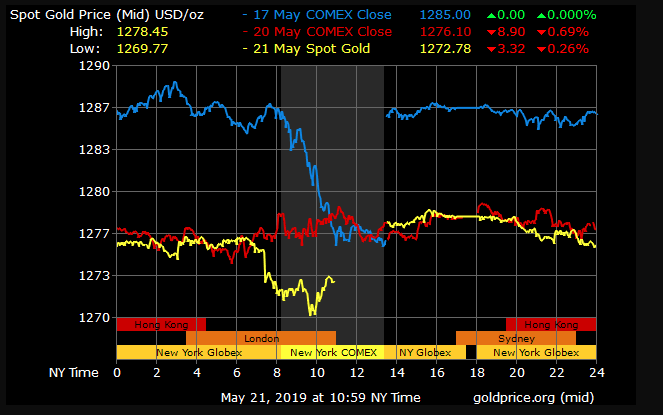

Gold Price Chart


More articles from Conor Maloney


