The parade of ugly US economic data for the month of April marched on this morning as CPI, the most commonly referenced marker for consumer price inflation, slowed slightly more than expected in the wake of the first full month of the current economic crisis.
Just in: U.S. inflation drops, core inflation declines by the most on record https://t.co/IAjWln51Qa pic.twitter.com/WGxUHRGYRu
— Bloomberg Markets (@markets) May 12, 2020
Key Takeaways
- Core consumer inflation (inflation ex. food and energy prices) slowed last month, only rising 1.4% compared to April 2019, vs. expectations for +1.7%
- The monthly decline of 0.4% is the steepest drop for core CPI since the data began being collected in 1957.
- Headline inflation also fell farther than expected, dropping to 0.3% vs. 0.4% exp.
Tuesday’ morning’s Consumer Price Index data for April was expected to be dismal, hit by the double impact of the coronavirus lock downs that have choked large sections of the US economy, and a collapse in oil prices. The number delivered on that dour promise, in fact reporting a deeper decline than expected although markets seem to largely have taken things in stride.
The crash of the headline CPI number from +1.5% last month below 0.5% in April is the most eye-catching of the bad looks, but it’s driving less concern from observers because of its sensitivity to gasoline prices which dipped more than 20% in April due to the turmoil in the oil market. Economists and policy makers who are looking at the data to judge the path forward for a post-lockdown recovery will, as is typically the case, focus on the less volatile “core CPI” read.
Core CPI fell -0.448%, meaning that it was very close to -0.5% m/m. The y/y fell to 1.44%. The chart looks like a lot of the other charts we're seeing these days. But of course devil will be in the details. pic.twitter.com/VmWCLxKxOl
— Michael Ashton (@inflation_guy) May 12, 2020
There we see what was largely expected for April’s data set, if sometimes to a deeper degree. Core “goods” fell into a deflationary slide for the month, while core “services,” which are both more easily accessible online (generally speaking) and more in-demand with large swaths of the populations in quarantine/lockdown, slowed but managed to keep growing at a pace above 2% (YoY.) The list of hardest hit categories is unsurprising, with air travel, hotel lodging, and apparel bearing the brunt of the US’ dramatic slowdown in economic activity outside the home.
Now that we’ve seen both the CPI read for April and the Federal Reserve’s PCE data set, we turn towards May and a much greater degree of uncertainty. Most major US metro areas were under one level of restriction or another for the whole of April, so we mostly knew what to expect for April’s top-tier economic data. But, I touched on in Monday’s weekly preview, with different regions of the country starting to tip-toe towards more normal economic function and lifting constraints at different paces through the month of May—to still entirely unknowable degrees of success or failure—it’s much more difficult to anticipate what the next range of inflation data will look like and what it will mean for hopes of recovery. From a trader’s perspective, this make it harder to effectively price-in expectations while also raising the odds of volatility around the data’s eventual release.
Market Reaction
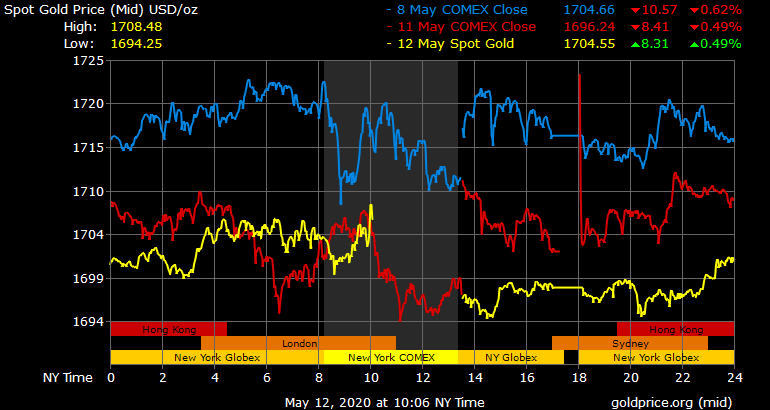
Roughly an hour after the release of April’s CPI data and following the cash-trading open for US stock markets, gold prices are sharply up and trading above $1705/oz although with other stories driving market focus and the newsflow the majority of that price movement is likely unrelated to the drop in inflation. As the data was printed and came in slightly worse than expected, we actually observed a similar dynamic to what we experienced around last week’s labor data: the risk-off impulse sent the current safe-haven kind US Dollar higher while gold and Treasuries sold off a bit. Gold did find reliable support at $1700/oz again before the recent rally higher. At the time of writing, US equities are mixed but fairly flat on the day, while the US 10-year yield is running at 0.7%.

Gold Price Chart


More articles from John Moncrief


