Home prices rose 3.2% annually in September, accelerating from 3.1% growth the month before according to the S&P CoreLogic Case-Shiller U.S. National Home Price Index. Home prices in the 10-city composite rose 1.5%, with 2.1% growth in the 20-city composite.
Key Takeaways
- Home prices are accelerating, with 3.1% annual growth in September. Tight inventory and land shortages have constricted supply, creating increased demand.
- The 10-city composite saw no change at 1.5% growth, while the 20-city composite saw a 0.1% increase to 2.1%.
Home prices in Phoenix, Charlotte, and Tampa saw the highest annual gains, with increases of 6.0%, 4.6%, and 4.5% respectively. Half of all cities in the 20-composite index saw accelerated price growth for the year ending September 2019 compared to the year ending 2019. The Sun Belt is the area with the most price growth, an appealing location because housing is relatively affordable compared to other regions. San Francisco was the only city to show annual price declines, with a -0.7% decrease in price.
Affordability benefited from the drop in mortgage rates, which fell over 130 basis points from the multi-year highs seen 12 months ago. Thanks to monetary easing policies put in place by the central bank, rates have fallen from 4.94% to around 3.6%, incentivizing and enabling buyers to to enter the market. However, with a low inventory, prices are rising quickly. Lower priced homes are in particularly short supply, and this category has seen the most accelerated price growth as a result.
So a very familiar S&P CoreLogic Case-Shiller Report today. At the national and 10/20-city level, basically same story as last month after revisions. Home price growth cool down ends. But man, what a cool down in the gold-rush markets of San Francisco and Las Vegas. Short thread: pic.twitter.com/JIhvn19sey
— Ralph B. McLaughlin (@HousingRalph) November 26, 2019
Expert Outlook
“After a long period of decelerating price increases, it’s notable that in September both the national and 20-city composite indices rose at a higher rate than in August, while the 10-city index’s September rise matched its August performance,” said Craig J. Lazzara, managing director and global head of Index Investment Strategy at S&P Dow Jones Indices. “It is, of course, too soon to say whether this month marks an end to the deceleration or is merely a pause in the longer-term trend.”
Speaking on an increase in new home sales in the US, the National Association of Realtors chief economist Lawrence Yun recently cited the price growth as a problem. “The buyers are coming back, but the lack of inventory is pushing up prices, in my view, way too fast.”
Market Reaction
Gold prices have seen relatively little change in response to the news. Spot gold last traded at $1,455.81/oz, down -0.05% with a high of $1,459.14/oz and a low of $1,451.46/oz. Trading within a tight range today, gold is possibly facing some selling pressure due to upbeat news on the trade war negotiations. Negotiators reportedly discussed matters on Monday, with the Chinese media saying both nations had “reached a consensus on properly resolving latest issues.”
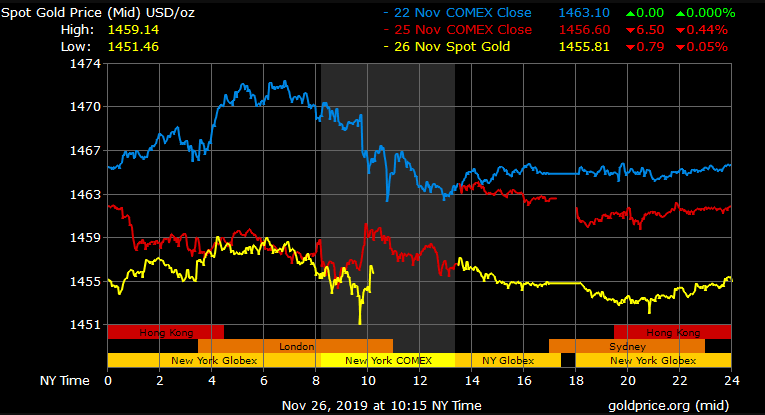

Gold Price Chart


More articles from Conor Maloney


