US home sales have disappointed again this week, with sub-expectations existing home sales data released on Tuesday closely followed by a miss in new home sales on Wednesday. Year-over-year, single-family home sales rose 7% in June, and overall new home sales rose 4.5% vs. 5.4% expected and compared to -7.8% the month prior.
Key Takeaways
- New home sales rose at a lower pace than expected in June at 4.5% growth vs. 5.4% predicted.
- Single-family homes rose 7% annually to 646,000, the first gain in three months.
- New home sales for May have been revised lower from 626,000 to 604,000 with March and April figures also revised lower, indicating weakness in the market.
The housing market continues to flounder as both new and existing home sales missed the mark in June, with new home sales figures for the previous three months revised lower. Annually, single-home sales rose 7% with the median sales price much the same as last year at $310,400.
The data indicates that the market hasn’t yet found forward momentum despite the lowest unemployment rate in nearly 50 years as well as a significant reduction in the rate of 30-year fixed mortgages which peaked at 4.94% in November before dropping to the current rate of 3.81%. While the Fed is likely to introduce the first interest rate cuts in over a decade this month, the affordable housing continues to elude many would-be buyers amid land and labor shortages and high prices.
The National Association of Realtors (NAR) states that existing home sales, which account for 90% of the housing market, dropped significantly in June with a -1.72% decline vs. just -0.2% expected as median existing home prices reached an all-time high of $285,700. Construction for new properties fell and permits, an indication of future construction, hit a two-year low.
See that little flip up at the end? That is what may make headlines, but the trend for new home sales (and building) is in the gutter. pic.twitter.com/esZ5rxM2Y4
— Robert Frick (@RobertFrickNFCU) July 24, 2019
Report Data
The number of properties sold for which construction had not yet begun rose to 205,000, the highest since November 2017, indicating an uptick in builder backlogs. The supply of homes at the current rate of sales dropped from 6.3 months to 6.7 months in May, and the number of new homes for sale at the end of the month in June rose from 309,000 in June 2018 to 338,000 in June 2019. A 6-month supply is considered balanced.
Regionally, new home sales saw a major uptick in the West with the biggest gain since August 2010. Sales also rose in the populous South, but dropped in the Midwest to the slowest pace since September 2015. The number of completed homes for sale is now at the highest level since November 2010. New home sales are considered a more timely indicator of the health of the housing market than previously-owned homes, as they are calculated when contracts are signed rather than when contracts close.
Market Reaction
Gold has seen upward momentum following the news, last trading at $1,424.24/oz, up 0.29% and now hovering near the daily high of $1,428.30/oz with a low of $1,416.35/oz. The price of spot gold may also have been driven upward by the news that the US Markit Manufacturing PMI dropped unexpectedly to the lowest point in almost a decade.
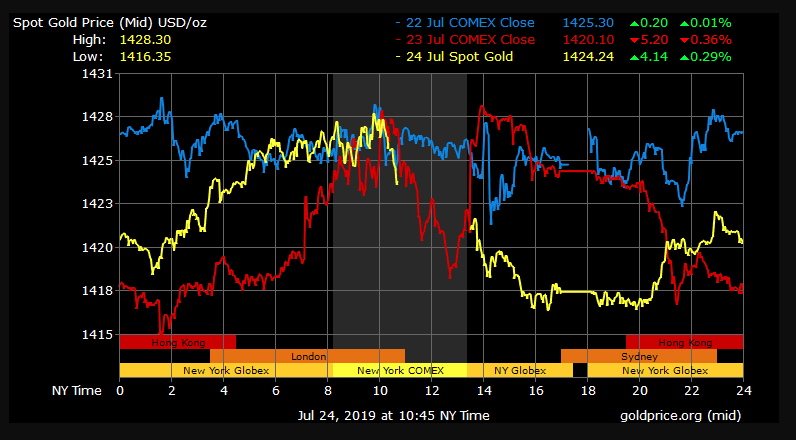

Gold Price Chart


More articles from Conor Maloney


