Happy Friday, traders. Welcome to your weekly recap of the gold market.
So, what kind of week has it been?
The dictionary definition of “up-and-down” I’d say. As we covered on Monday, risk-off trading spiked hard on the back of heavy news-flow around sharpening US-China trade tensions and a serious round of new tariffs announced. Initially it looked as if gold might finally break gravity at $1300, but as the trade headlines largely went quiet and the majority of important US macroeconomic data bested expectations gold’s hyperbolic trajectory stalled out, and we now see the yellow metal trading lower than Sunday night’s market open.
Let’s take a closer look.
Gold Booms as Trade Tensions Heat Up
Monday was the strongest day for gold in over a month. Picking up from where our weekly preview left off, global equities continued to fall throughout the day in reaction to escalating tariffs and tensions between the US and China as the trade conflict has gone hot again. After being rebuffed on a handful of midday attempts to break $1300, gold spot prices settled into the afternoon around the $1299/oz level, and close the day just below the resistance line at that major psychological mark.
Equities Rebound, but Gold Prices Hold on to Gains
Asian markets would open shaky on Tuesday, and another negative session would be enough to push gold above the $1300-line overnight. It would fail to create enough momentum however, and in Europe the Stoxx 600’s positive morning provided enough risk-on sentiment to encourage selling that brought gold back to $1298/oz at the start of New York’s Tuesday.
US markets took off running with the President’s tweets about feeling optimistic that the trade dispute will have a pleasant resolution by mid-summer. Equities markets roared back from their Monday drubbing, boosting the US Dollar. The gold market as a result felt sluggish and spot price failed to make another attempt at $1300. While the market would manage to hold on to support around $1295, the lack of momentum was the first indication that Monday’s price-surge wouldn’t hold throughout the week, as the rocket fuel of US-China trade headlines would more or less dry up for the week after Tuesday.
As US Manufacturing Data Improves, Gold Loses Momentum
After some increased pressure on gold price from an admittedly convoluted Asia session-- in which a swath of important Chinese economic data disappointed but local equity markets gained ground-- gold spot found its momentum again during the European session and looked to re-test resistance at $1300/oz heading into Wednesday’s New York trading.
In reality, gold would make its last uninspired run at $1300 just ahead of the first swath of notable US economic data for the week. While April’s Industrial Production was a real disappointment, metrics for the US manufacturing sector began to pull up from their recent trend downwards with an upside surprise from May’s the NY Empire State Manufacturing Index. It will remain to be seen if America’s workhorse of old is actually turning things around after a slump or if this week’s data, which included another beat on Thursday morning’s report of the Philly Fed Manufacturing Index, represents more of a dead cat bounce. Either way, it was enough of a risk-on signal Wednesday morning to trigger a $5 fall in gold prices. While the rest of the day would see some choppy trading, gold wouldn’t find much air above $1295/oz for the rest of the day.
A quiet session of Asian trading was followed by a buying surge at the European open. The rush would inevitably peter-out within the hour, and that would be the failure that finally broke gold’s support for the week.
More Positive US Data Finally Breaks Resolve
By the time Thursday morning’s US economic data hit the wires at 8:30am EDT, gold prices had already weakened well below $1295/oz. The US economy and its Greenback were lifted by the Philly Fed data, lower than expected Initial Jobless Claims for the week, and an improvement on expectations for April Housing Starts. From there, it was a nosedive morning for gold.
As we’ve often talked about, when gold elevates toward major technical or psychological levels (like $1300) and then repeatedly fails to break through, market gravity increases with every failed attempt; at the first application of external pressure (like a surging US Dollar on the back of positive economic data,) gold’s price support collapses. This time, to the tune of $10+ and resting through the afternoon at $1285 support. The continued selling through to this morning has been motivated more by Thursday’s price drop than any additional news flow—why hold gold here, the market asks, when it’s still unlikely to break $1300?
Gold Falls Farther as Consumer Sentiment Improves
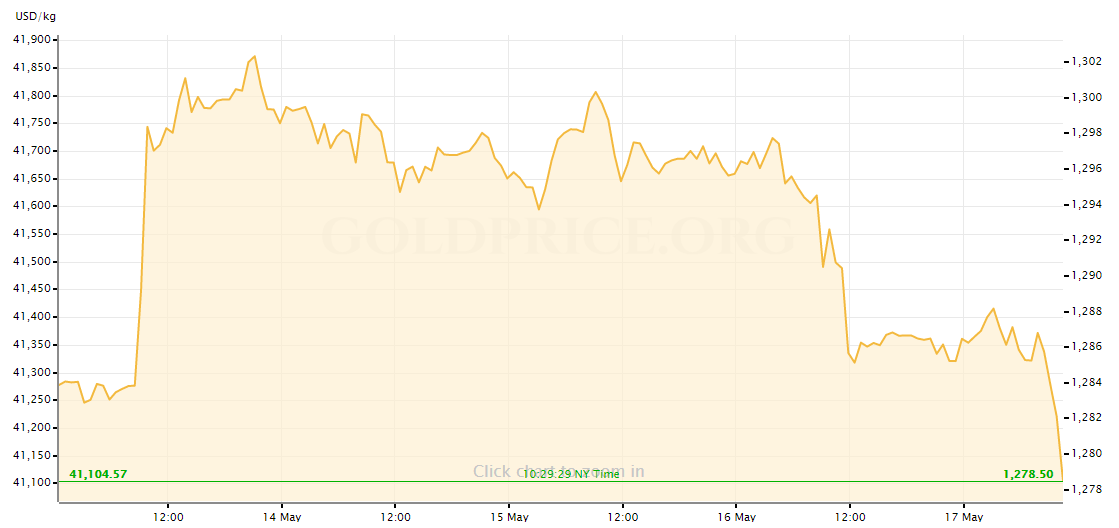
Yellow metal maintained its $1285 support through Asia and Europe’s end of the week, but as US traders have come online this morning we see gold collapsing through support again to $1280. At time of writing, that further support has also broken, as a strong University of Michigan Consumer Sentiment number has pushed gold lower against the Dollar. At time of writing, gold by the ounce trades just above $1278.
Next Up
And so that’s how the gold market looks, limping into next week. The docket coming up is again fairly light, with Wednesday’s FOMC minutes the only heavy hitter inked onto the calendar. That said, expect the ongoing US-China trade spat to be the dominant force in Dollar and Gold markets for a consecutive week assuming the news-flow returns.
Enjoy your weekend, traders. I’ll see you all back here on Monday for a look at the week ahead.

Gold Price Chart


More articles from John Moncrief


