The US trade deficit hit an 8-month low in February, spurred on by a sharp increase in civilian aircraft exports. The deficit dropped from $51.1 billion to $49.4 billion.
Key Takeaways
- The trade deficit sunk from $51.1 billion to $49.4 billion, defying expectations of a rise to $53.4 billion.
- It’s possible that the surge in civilian aircraft exports is related to the grounding/recall of Boeing Co.’s faulty 737 Max aircraft.
- The deficit is at the lowest point since June 2018.
The drop in the deficit reflects a 1.1 % rise in exports and a 0.2% increase in imports according to the Commerce Department’s report on Wednesday. The trade gap with China has narrowed to $30.1 billion.
When comparing the first two months of 2018 to January-February 2019, the trade deficit has dropped 7.6%. However, exports aren’t out of the woods, with the Boeing scandal and a general global economic slowdown impacting progress. The situation with Boeing is likely to cause a -0.2% drag on Q2 GDP overall.
Meanwhile, inventories in US businesses continue to build up, pointing to struggling import demand. Net exports have now seen positive activity for two months in a row.
The goods gap shrank to $72 billion, and the services surplus rose to $22.6 billion. Civilian aircraft exports rose 60.5% or $2.2 billion in February, with smaller gains seen in passenger cars, pharmaceuticals, and crude oil. Consumer goods imports rose, and industrial supplies and materials shrank.
The merchandise trade deficit widened with Mexico, the trade surplus with Canada contracted, and the trade gap between the US and Europe narrowed. The real petroleum gap dipped with falling exports and imports, and the goods-trade shortfall excluding petroleum sunk to $69.2 billion.
Excluding the influence of prices, the US goods trade deficit shrunk from $81.8 billion from $83.5 billion the month before. This figure is indicative of GDP.
So the US Feb Trade Balance data has bolstered my Q1’19 GDP forecast by 0.4% to 1.9%. Important to note much that growth will be due to non sustainable factors & inventories which will result in drag on growth in the current quarter.
— Joseph Brusuelas (@joebrusuelas) April 17, 2019
Trade War Deadline Looming
It’s possible that the increased activity may reflect the urgency of businesses rushing to beat the March 1 deadline that was (at the time) set for either resolving the trade war or increasing tariffs on China. The deadline was later lifted indefinitely after US President Trump cited “substantial progress” in negotiations.
Chinese imports in February dipped 3.6% compared to the prior month, but exports rose 21.6%. American soybean exports rose 15.6% in February after already quadrupling in January. The US merchandise deficit with China narrowed annually, but imports and exports have suffered significant decline as a result of the ongoing conflict.
World economic growth continues to decline, and this is likely to impact trade as well. The IMF lowered growth forecasts last week to the lowest levels since the recession, and US economists have also forecast a slowdown in Q3 and Q4.
Market Reaction
Gold is currently trading at $1,274.49, down -0.96% on the day with a high of $1,279.58/oz and a low of $1,273.90/oz. Equities are holding near six-month highs and thus creating selling pressure on the precious metal which hit a yearly low on Tuesday at $1,272.70/oz.
Commerzbank commented on the slide, stating that it was unusual given the loose monetary policy in action worldwide.
“We attribute the price fall yesterday to technical selling after the price dropped below the technically important 100-day moving average. We do not understand why the gold price should be weak given the very loose monetary policy pursued by many Western central banks – apparently the ECB is even considering price-level targeting. That said, we do see a further short-term downside risk for the gold price in the current market environment, which is characterized by extreme complacency among market participants and increased risk appetite.”
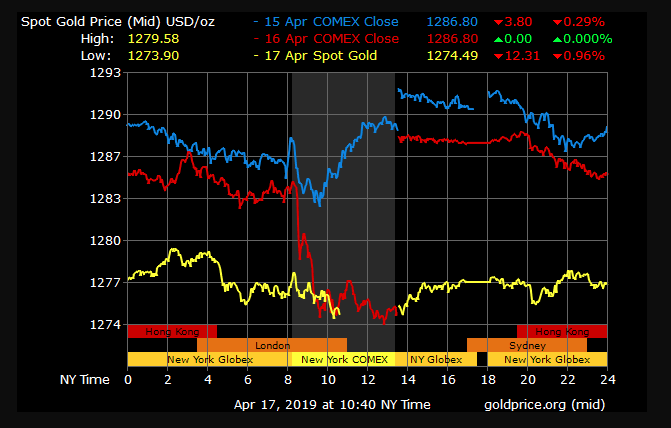

Gold Price Chart


More articles from Conor Maloney


