US home sales dropped more than expected in June with a -1.72% decline vs. just -0.2% expected. Despite lower mortgage rates, the housing market continues to struggle under current economic conditions.
Key Takeaways
- US home sales in June dropped from 2.5% to -1.72% in June, well below the projected figure of -0.2%.
- June sales came in at 5.27 million units, and May sales were revised upward from 5.34 million to 5.36 million.
- Although unemployment is at the lowest level in decades and mortgage rates have seen a significant drop, home sales continue to show weakness in Q3 2019.
Existing home sales, which account for 90% of all US home sales, dropped -2.2% annually in June, the 16th consecutive year-on-year decline in that category. After a turbulent 2018 for housing, the market continues to struggle and show signs of weakness.
The poor activity is partly due to a lack of supply due to land and labor shortages, particularly in the lower-price housing category. Permits for future home construction hit a two-year low in June according to a government report released earlier this month, indicating that the supply problem will persist in the near future.
The rate of 30-year fixed mortgages dropped from a 7-year high of 4.94% in November to just 3.81%, but affordability has yet to manifest in the housing market. The Federal Reserve is expected to introduce the first interest rate cuts in ten years next week, perhaps improving the situation for would-be homeowners.
Existing-Home Sales Decreased to 5.27m in June. Source: National Association of Realtors, Calculated Risk pic.twitter.com/nuuccZBT3x
— The Borderplex Alliance (@TheBorderplex) July 23, 2019
Regional Data
In the Northeast and Midwest, sales rose, but fell in the South and West which have a greater population density and account for more sales overall. The number of previously owned houses on the market rose slightly in June from 1.91 million to 1.93 million, the same figure as this time last year. However, the median price of a house rose 4.3% to $285,700 in June, a record high. Home prices have now increased for 88 months in a row.
At the the pace of sales seen in June it would take 4.4 months to exhaust the currently available inventory, a 0.1 gain from May figures. This fails to meet the generally accepted ideal of six-to-seven months.
Expert Outlook
“Home sales are running at a pace similar to 2015 levels – even with exceptionally low mortgage rates, a record number of jobs and a record high net worth in the country,” said Lawrence Yun, NAR’s chief economist. “Imbalance persists for mid-to-lower priced homes with solid demand and insufficient supply, which is consequently pushing up home prices.”
Market Reaction
Gold prices have seen little reaction to the news, ticking slightly upward but still trading in negative territory at $1,424.13/oz, down -0.08% with a high of $1,428.82/oz and a low of $1,414/84/oz. Gold prices saw some mild upward momentum following the joint release of the home sales report and the results of the Richmond Fed manufacturing index, both of which were below expectations.
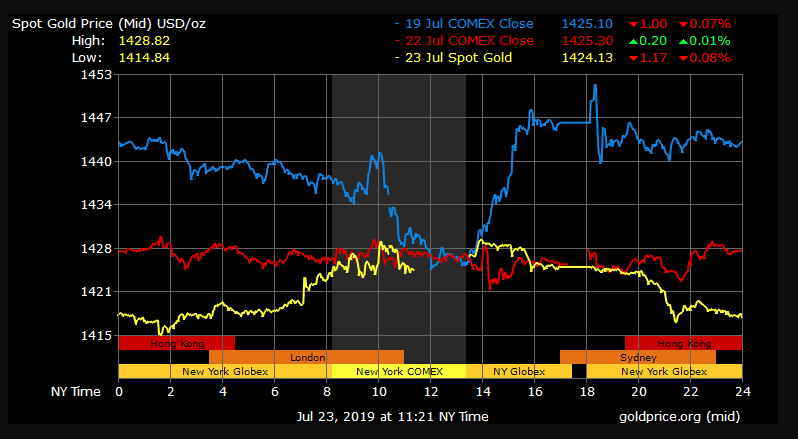

Gold Price Chart


More articles from Conor Maloney


