Though in relative decline, the Richmond Fed Manufacturing Index still saw moderate expansion in October. The index is a composite representing a weighted average of the indexes for shipments (33%), new orders (40%), and employment (27%).
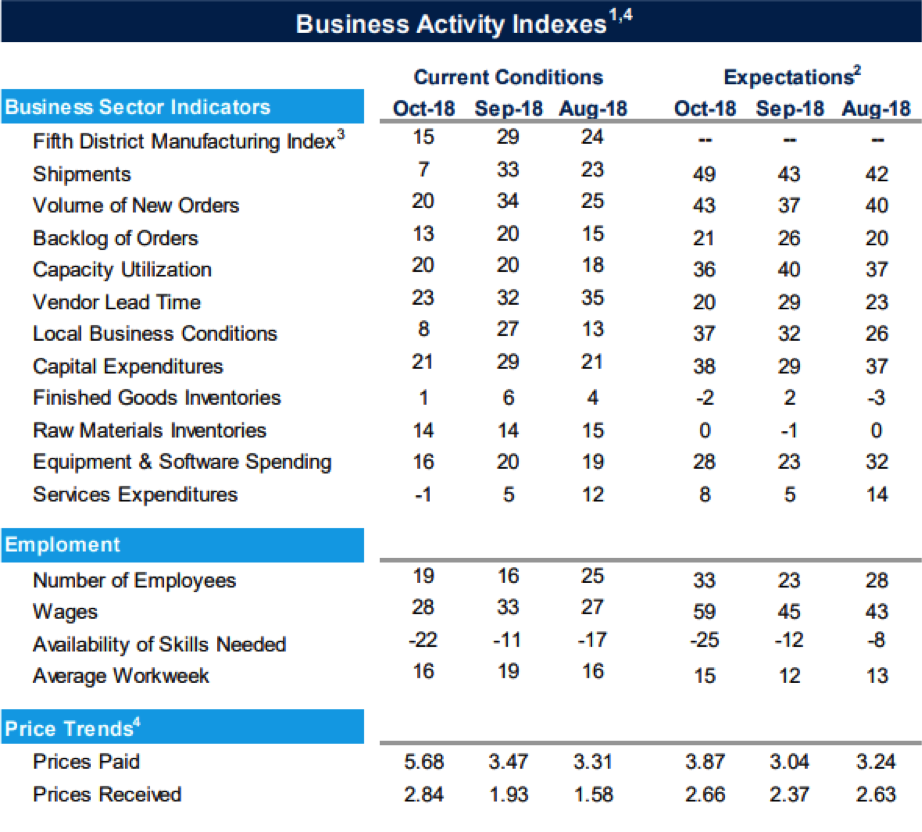
Today’s survey by the Richmond Federal Reserve shows that the composite index declined from 29 to 15 between September and October 2018, significantly below the expected figure of 24.
Business Sector
The shipping index declined from 33 to 7 with the index for new orders sinking from 34 to 20. It should be noted that numbers above zero indicate expansion. Order backlog has decreased and raw inventories have risen from -1 to 0. Local business conditions are also up from 32 to 37.
While Capital Expenditures sunk from 29 to 21, matching August’s figures, Service Expenditures saw a decline marking the end of a growth period with a slump from 12 in August to 5 in September and -1 in October. The Finished Goods Inventories index also dropped closer to zero as it sunk from 6 to 1 this month following a mild increase from 4 in August. Despite the decline, fed survey respondents were reportedly optimistic and still expecting to see more growth in Q4 2018.
Employment
Employment actually rose in October from 16 to 19, although the wage index and workweek index dropped, remaining above zero. The Skills index however dropped to an all-time low of -22 as businesses struggled to find skilled workers in their fields, something which respondents did not foresee an immediate solution to with expectations for the issue to persist over the next six months. September’s Skills index was -11 and August’s was -17, marking a trend reversal in the amount of skilled workers available.
The Average Workweek index dropped from 19 to 16.
Price Trends and Index List
Prices Paid and Prices Received saw accelerated growth from 3.47 to 5.86 and 1.93 to 2.84 respectively.
Price Trends and Index List Prices paid and received saw accelerated growth from 3.47 to 5.86 and 1.93 to 2.84 respectively. The Prices Paid index is still seeing more growth than the Prices Received index with the growth of prices paid at its highest since May 2011 and continued price growth expected by survey respondents.
Below is the complete list of indexes released by the Richmond Federal Reserve for October 2018. Each index represents the percentage of responding businesses reporting an increase vs the percentage reporting a decrease, with the data in this survey coming from 76 firms in total.
Expectations refer to a time period of six months from the current survey.
Manufacturing index results can often create volatility in the market, but gold prices are holding relatively firm with a .78% gain today as trading continues at $1,230 per ounce of gold.

Gold Price Chart


More articles from Conor Maloney


