Happy Friday, traders. Welcome to our weekly market wrap, where we take a look back at these last five trading days with a focus on the market news, economic data and headlines that had the most impact on gold prices—and may continue to into the future—as well as the charts for silver, the US Dollar and other key correlated assets.
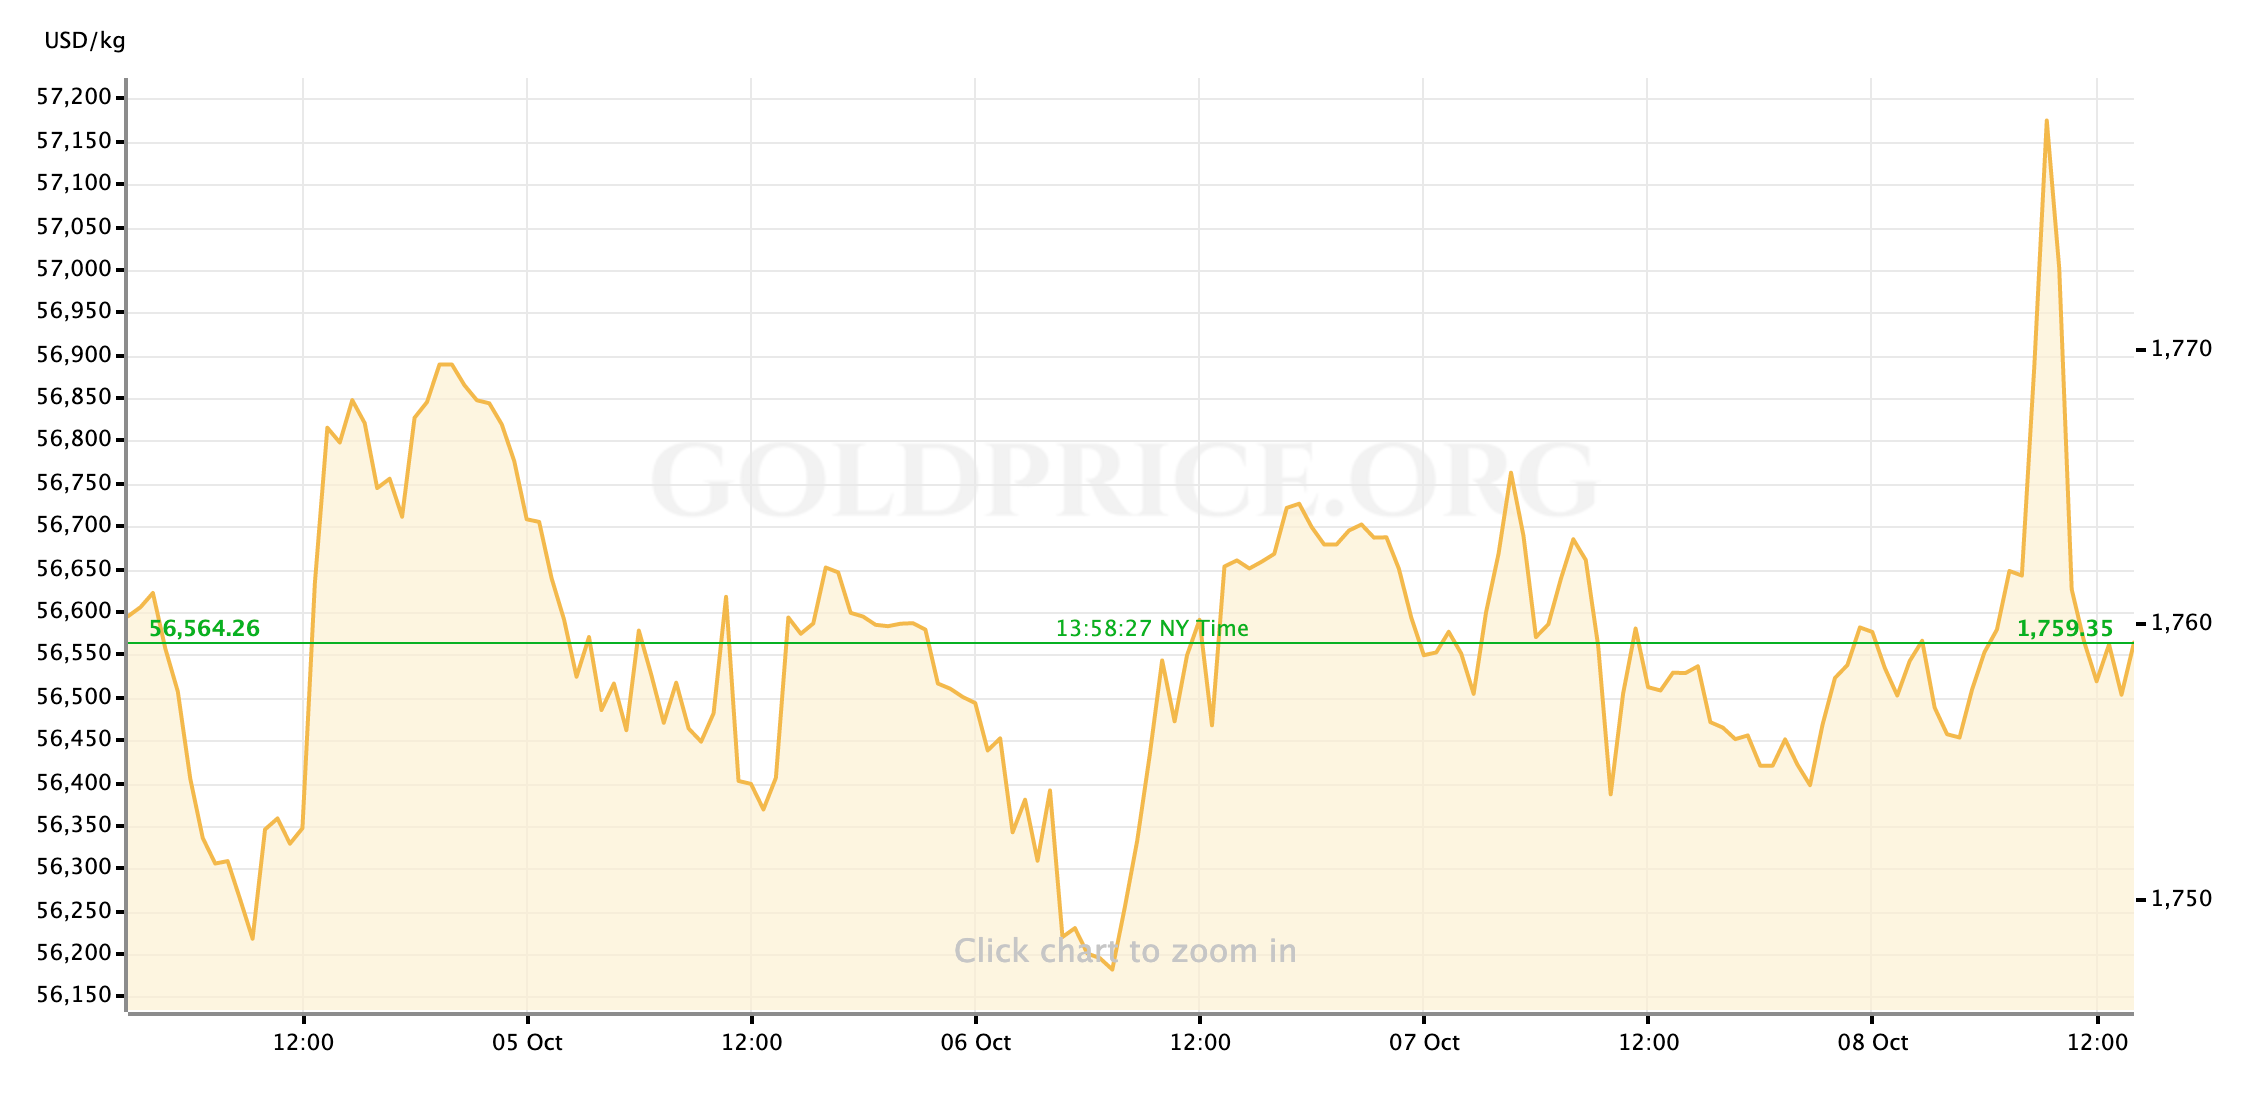
After a week of up-and-down but ultimately smooth trading, gold prices saw a flurry of activity on Friday morning that outpaced any other volatility the days prior. As we’ll discuss, the pop amounted to a lot of energy expended with very little change, as prices are closing the week just slightly below Sunday evening’s opening bids.
So, what kind of week has it been?
Gold’s price chart has snaked its way through an up-and-down week that is set to culminate with the yellow metal trading at a slight discount to where it began on Sunday. Before Friday morning it looked as though we wouldn’t have much to talk about in terms of relevant economic data or market shifts, but the September Jobs Report delivered interesting news just in time.
The most common descriptor of the full Jobs Report has been as a “mixed bag,” but the undoubtable headline in the matter is a second consecutive miss—a deep one—to the downside on the Non-Farm Payrolls number: analysts and economists’ were looking for a rebound to the neighborhood of 500,000 jobs-added, where the real number reported was just 194,000.
Contributing to the “mixed” read: the headline unemployment rate fell more than expected, going below 5% for the first time since the pandemic; Wage growth also ticked meaningfully higher (a positive sign of a strengthening labor market, but one that might lead to more persistent inflation as we go along.)
Gold prices, having traded the majority of the week within a solid band of roughly $1750/oz up to the high $1760s, immediately rallied higher when the report hit the transom. As we suggested at the start of the week, this can be read primarily as an investor reaction to what this disappointing labor market data could mean for the Fed’s ultimate willingness to go ahead with plans to taper asset purchases at their next meeting. Remember: this was the last in-depth assessment of the US labor market that Fed officials will have access too before the November FOMC meeting (October’s Jobs Report will be released later that week.)
It’s clear that the initial investor reaction (particularly in gold prices) to the September NFP was to position for the Fed to delay the start of its taper. Gold up, Treasuries up, and Dollar down align generally with what we would expect to see. Within the hour though, and ahead of the open of cash trading in the US markets, the initial move ‘corrected’ and gold spot prices—from a two-week high above $1775/oz—fell swiftly back to support at $1755.
There’s an argument to be made that the primary reason for gold’s retracted rally was investors and mangers having time to better parse the Jobs Report which, in the details, was not as negative as the garish NFP miss would suggest. It’s safe to assume that played some role in Friday morning’s trading. It seems more likely though, given the correlations that remained strong all week, that gold prices came under particularly strong pressure when US Treasury yields rebounded from the initial sell-off and the benchmark US 10-year rallied above 1.6% for the first time in several weeks.
Gold prices had appeared to acclimate to the 10-year sitting above 1.5% this week, but as debt ceiling haggling continued to be the order of the day(s) in Washington, the higher yields clearly were applying some pressure on gold’s upside. The jump above 1.6% (a level that’s mostly held through Friday’s trading) may have been just one step beyond, and has snuffed out any chances for a gold rally to end the week.
Friday’s Jobs Report has had a definite impact on what investors and traders should be watching for next week. We’ll get updated reads on consumer inflation and retail sales growth in the US, which the Fed will have to rely on to greenlight a November taper now that the “substantial further progress” in the labor market data is under question. We’ll also get the minutes from the most recent FOMC meeting, which may shed some light on just how confident the committee as a whole are (or were) in the plan to taper support for the economy.
For now, traders, I hope you can get out and safely enjoy your weekend for the next couple of days. After that, I’ll see everyone back here on Monday for our preview of the week ahead.

Gold Price Chart


More articles from John Moncrief


