Happy Friday, traders. Welcome to our weekly market wrap, where we take a look back at these last five trading days with a focus on the market news, economic data, and headlines that had the most impact on gold prices—and may continue to into the future—as well as the charts for the US Dollar and other key correlated assets.
Gold prices are wrapping up what has been a generally quiet four days of trading following the US Independence Day break on Monday. The yellow metal is following on from Monday’s surprising break through the resistance of recent weeks and should close Friday’s trading at a multi-week high.
So, what kind of week has it been?
As far as gold markets are concerned, this holiday-shortened trading week was the summertime slump that it looked like it would be. After building off of last week’s consolidated gains to (somewhat surprisingly) break resistance at $1800/oz, the yellow metal’s chart experienced some occasional choppiness but lived for the most part within a $10 range. Equity markets were more active—or more unstable, at least—this week, as investors grappled with growing concerns about the continuing spread of Covid-19’s “delta variant” around parts of the world and its potential to unsettle the economic recovery in the US and abroad.
-
The major stock indexes fluctuated between small gains and small losses at the start of the week, before taking a battering on Thursday, with the major markers having fallen by as much as 1% or more at some points.
-
Thursday’s slide was led by reopening favorites, and the velocity of the drop seemed mostly due to what had been a more generalized uncertainty in the market about the delta variant crossing paths with a number of negative headlines, the flashiest of which was news that all spectators will be banned from Olympic events in Tokyo, which is the midst of a serious spike in Covid-19 cases and has declared a state of emergency.
-
Friday’s trading has been a clean reversal of Thursday’s ugliness, with reopening/reflation favorites pushing the US stock market to strong gains and new highs, encouraged by more cautious optimism in the US and new CDC recommendations for the fall that lay out a continued “return to normal.”
-
A somewhat confusing trend of weakening in US Treasury yields, which saw the benchmark 10-year yield fall to several month lows earlier in the week, also began retracing on Friday with the 10-year climbing back above 1.35% and relieving some additional investor concerns about the economy’s summer progress.
-
While gold prices have risen alongside the rebound in yields today, we’ll keep an eye out for a more excited rates rally which could present a more resistant headwind for the yellow metal.
-
-
Overall, all what little headline flow there was this week had a more direct impact on investors’ views of the equity markets than on positions in gold and other precious metals or key safe-havens; So, stocks were victimized by the thin volume of a holiday week much more than gold. Headline shocks notwithstanding, expect less volatility on Monday.
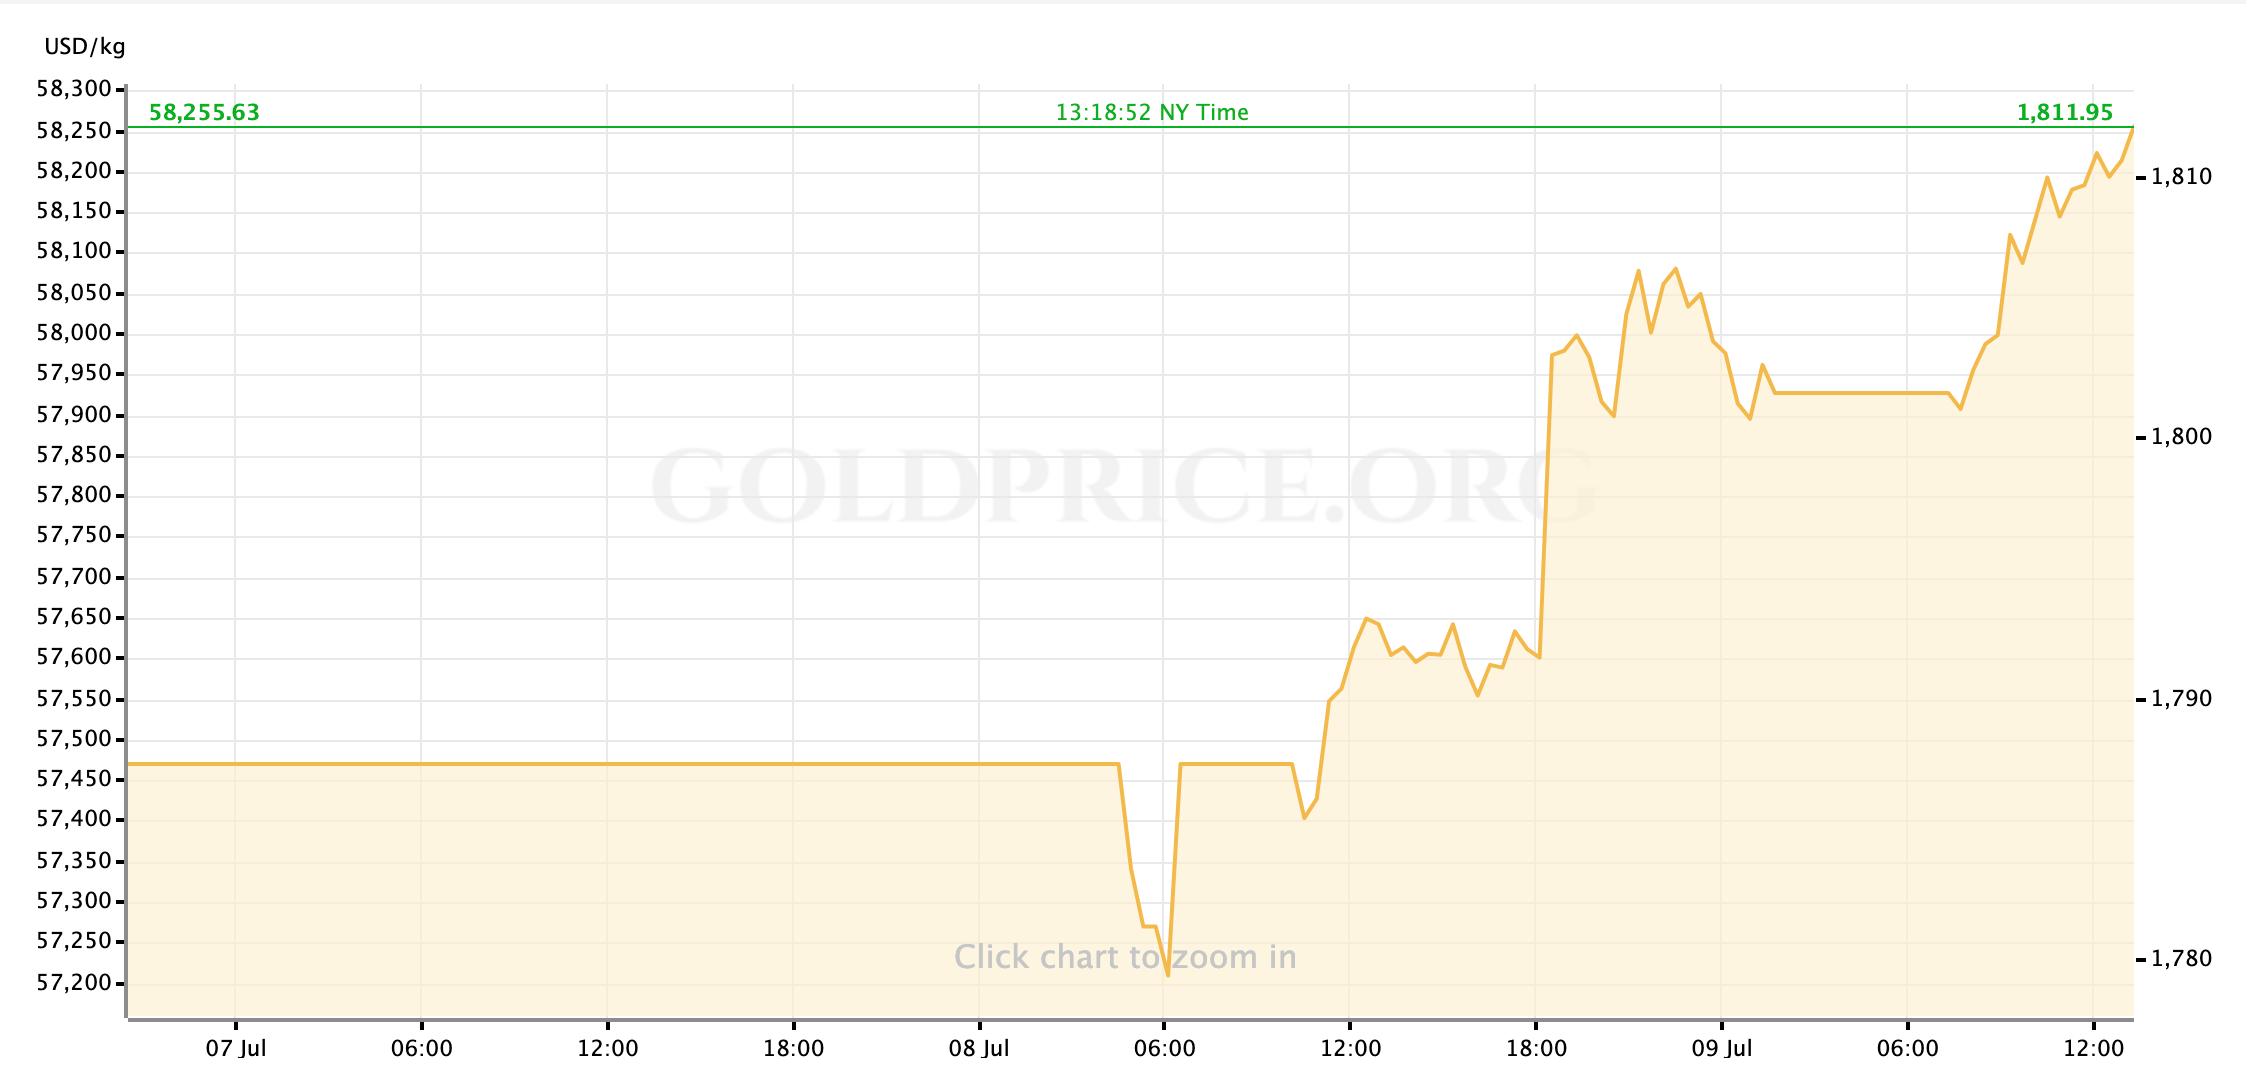
Gold has taken a few brief dips below a spot price of $1800/oz this week, mostly on the heels of failed efforts to break above $1810, but generally appears to be consolidating support just above that major psychological level and looks set to close trading with the highest offers we’ve seen in a few weeks. This is unquestionably positive for gold’s outlook through the slow summer months, but it does still feel like the yellow metal will need new motivating inputs to entice investors to bid the metal higher.
It ultimately had little impact on the course of gold’s (or the US Dollar’s) week, but Wednesday’s release of discussion minutes from June’s FOMC meeting was undoubtedly the most relevant event for both asset groups in the medium-term. As expected, there were no dramatic relations in the June notes. But, they did help us judge the shade of how the Fed as a body views the recent acceleration in the US economy’s recovery: Despite the “average dot” pulling forward in last month’s economic projections to assume two interest rate hikes by the end of 2023, the committee as a whole feel that recent improvements in the recovery are still far away from the “substantial” progress that would compel the Fed to tighten interest rates.
-
We also see in the minutes confirmation that the coming meetings will see the FOMC actively discussing the plan to begin tapering their asset purchase program. The Fed continues to make it clear that the full end of asset purchases must be completed ahead of any rate hikes.
-
Following this week’s FOMC minutes, the consensus trajectory for Fed policy through the end of the year remains the same: Jerome Powell & Co. are expected to present forward guidance about the timing of the first round of tapering at the Fed’s annual Jackson Hole Symposium in late August, with the first taper being announced probably at the final 2021 meeting in December (although at this point November’s meeting is still a “live” possibility.)
Using this “map”, it seems appropriate to expect the August Jackson Hole meeting to put strong pressure on gold prices as the yellow metal’s value is tarnished by concrete steps towards a higher interest rate regime. Between the initial forward guidance and the end of the year, then, gold and the Dollar will likely be much more reactive to major data points around the pace of the US economy as investors will be on the lookout for any bumps in the road that might delay the Fed’s plan to taper in December.
For now, traders, I hope you can get out and safely enjoy your weekend for the next couple of days. After that, I’ll see everyone back here on Monday for our preview of the week ahead.

Gold Price Chart


More articles from John Moncrief


