Happy Friday, traders. Welcome to our weekly market wrap, where we take a look back at these last five trading days with a focus on the market news, economic data and headlines that had the most impact on gold prices—and may continue to into the future—as well as the charts for silver, the US Dollar and other key correlated assets.
Gold prices are considerably lower at the end of a holiday-shortened trading week; Risk appetite continues to grow steadily across developed financial markets as little changed to alter the more optimistic outlooks for economic recovery in the US and around the world, which remain almost entire based on yet to be passed US fiscal stimulus and continued strides forward in the fight to contain the Coivd-19 pandemic.
So, what kind of week has it been?
Gold and Silver Prices Haves Slid All Week as Risk-Appetite Draws Investors’ Attention to Other Assets
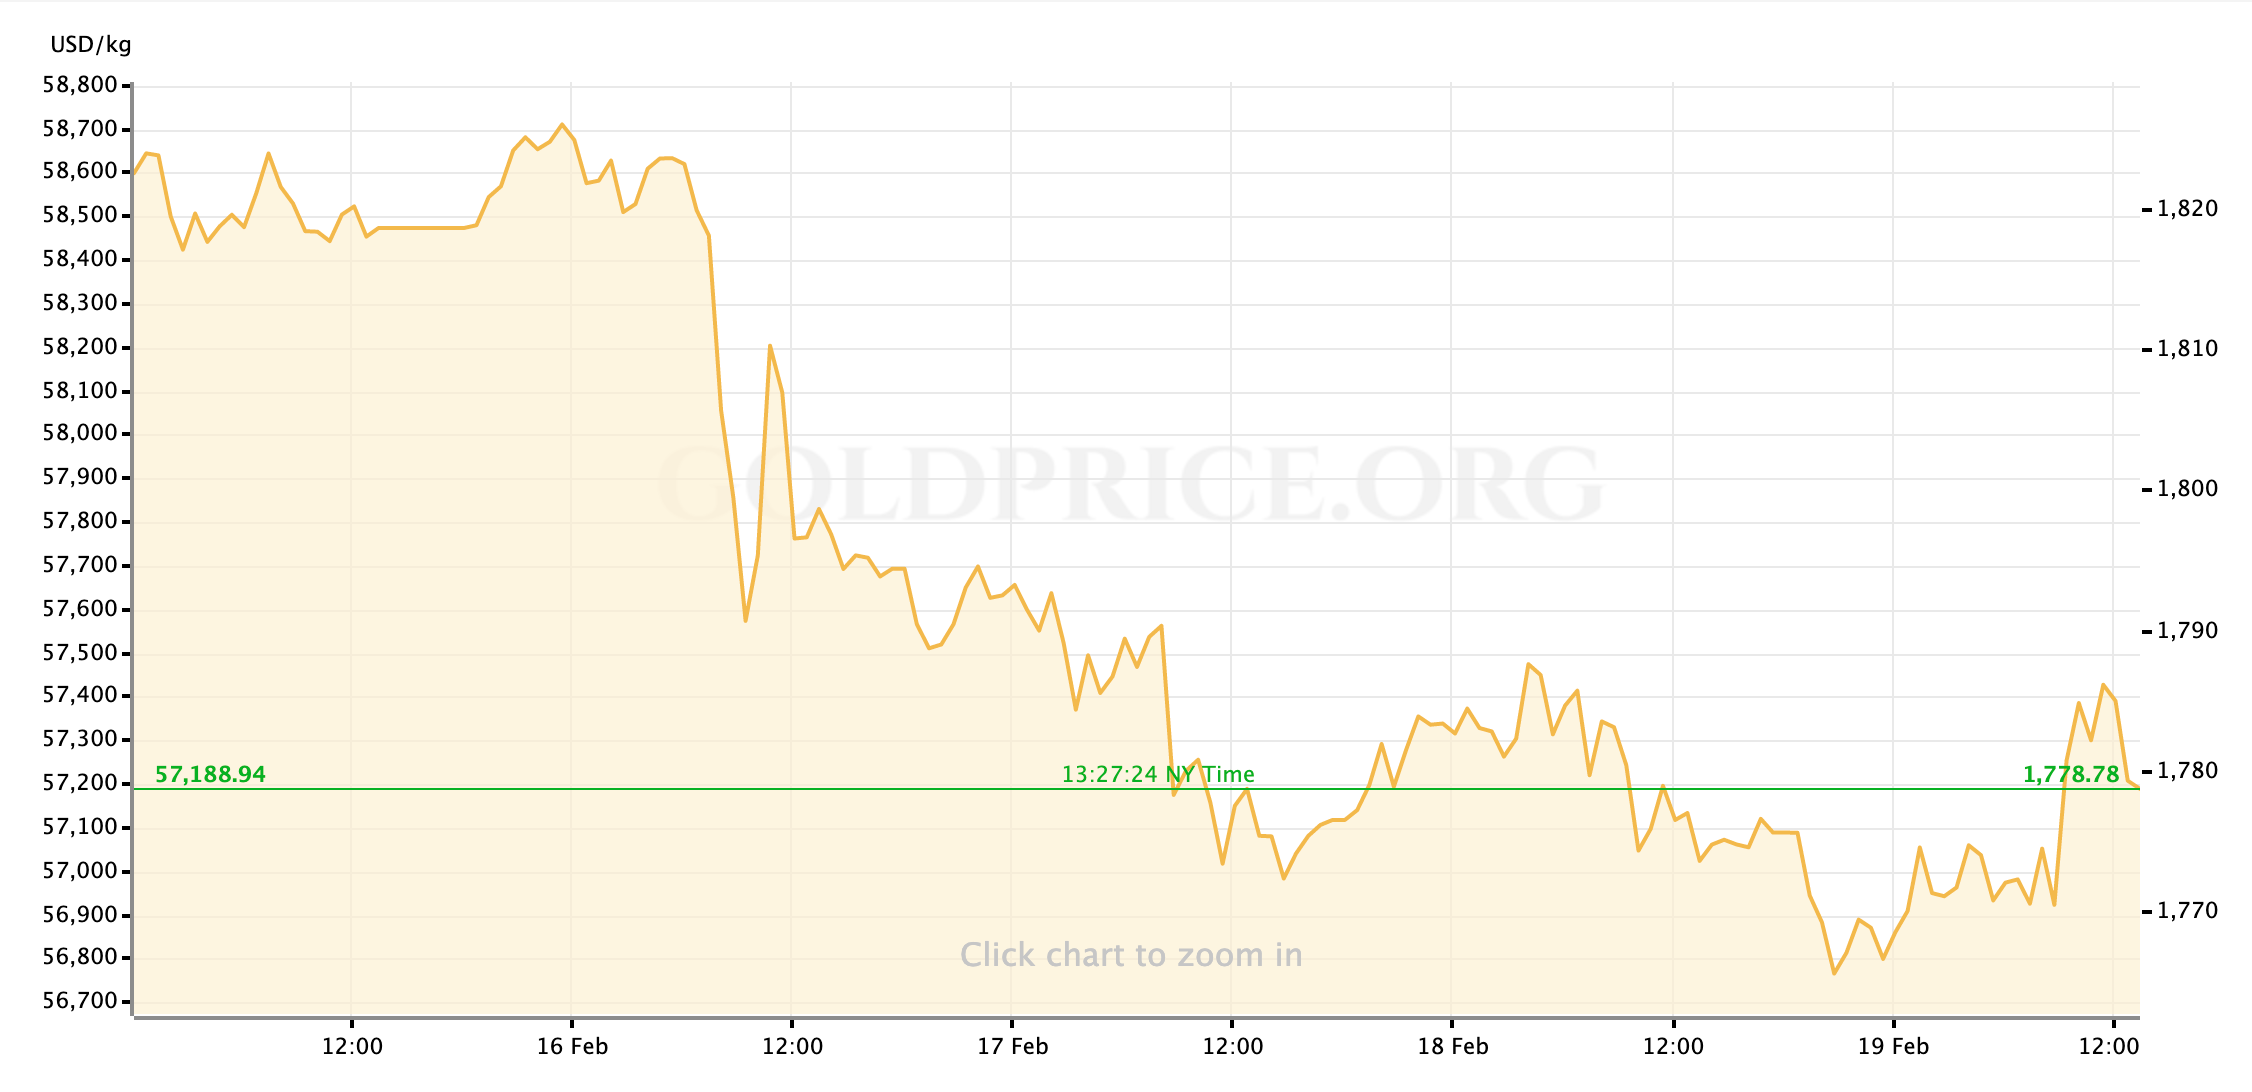
There’s no way around it but to say that this shortened trading week was a flat out bad one for shorter-term gold bulls. The brief rally in metals prices that we were tracking on Tuesday morning turned out to be a feint, as from there gold prices fell steadily through Tuesday’s trading session and into Wednesday. The slide well below previous support at $1800 was only stopped briefly late Wednesday morning as some buyers ventured into the gold spot market with prices at a 2.5-month low of $1770/oz, but by the end of the same US trading session it was clear that there was not enough interest in the yellow metal from either fundamentals- or technicals-focused bulls. Prices weakened further and from Wednesday afternoon until late Thursday night. gold spot prices floundered around the lowest levels we’ve seen in 8 months; Just before the start of Asian markets’ Friday sessions, prices put in their low of the week at $1760/oz.
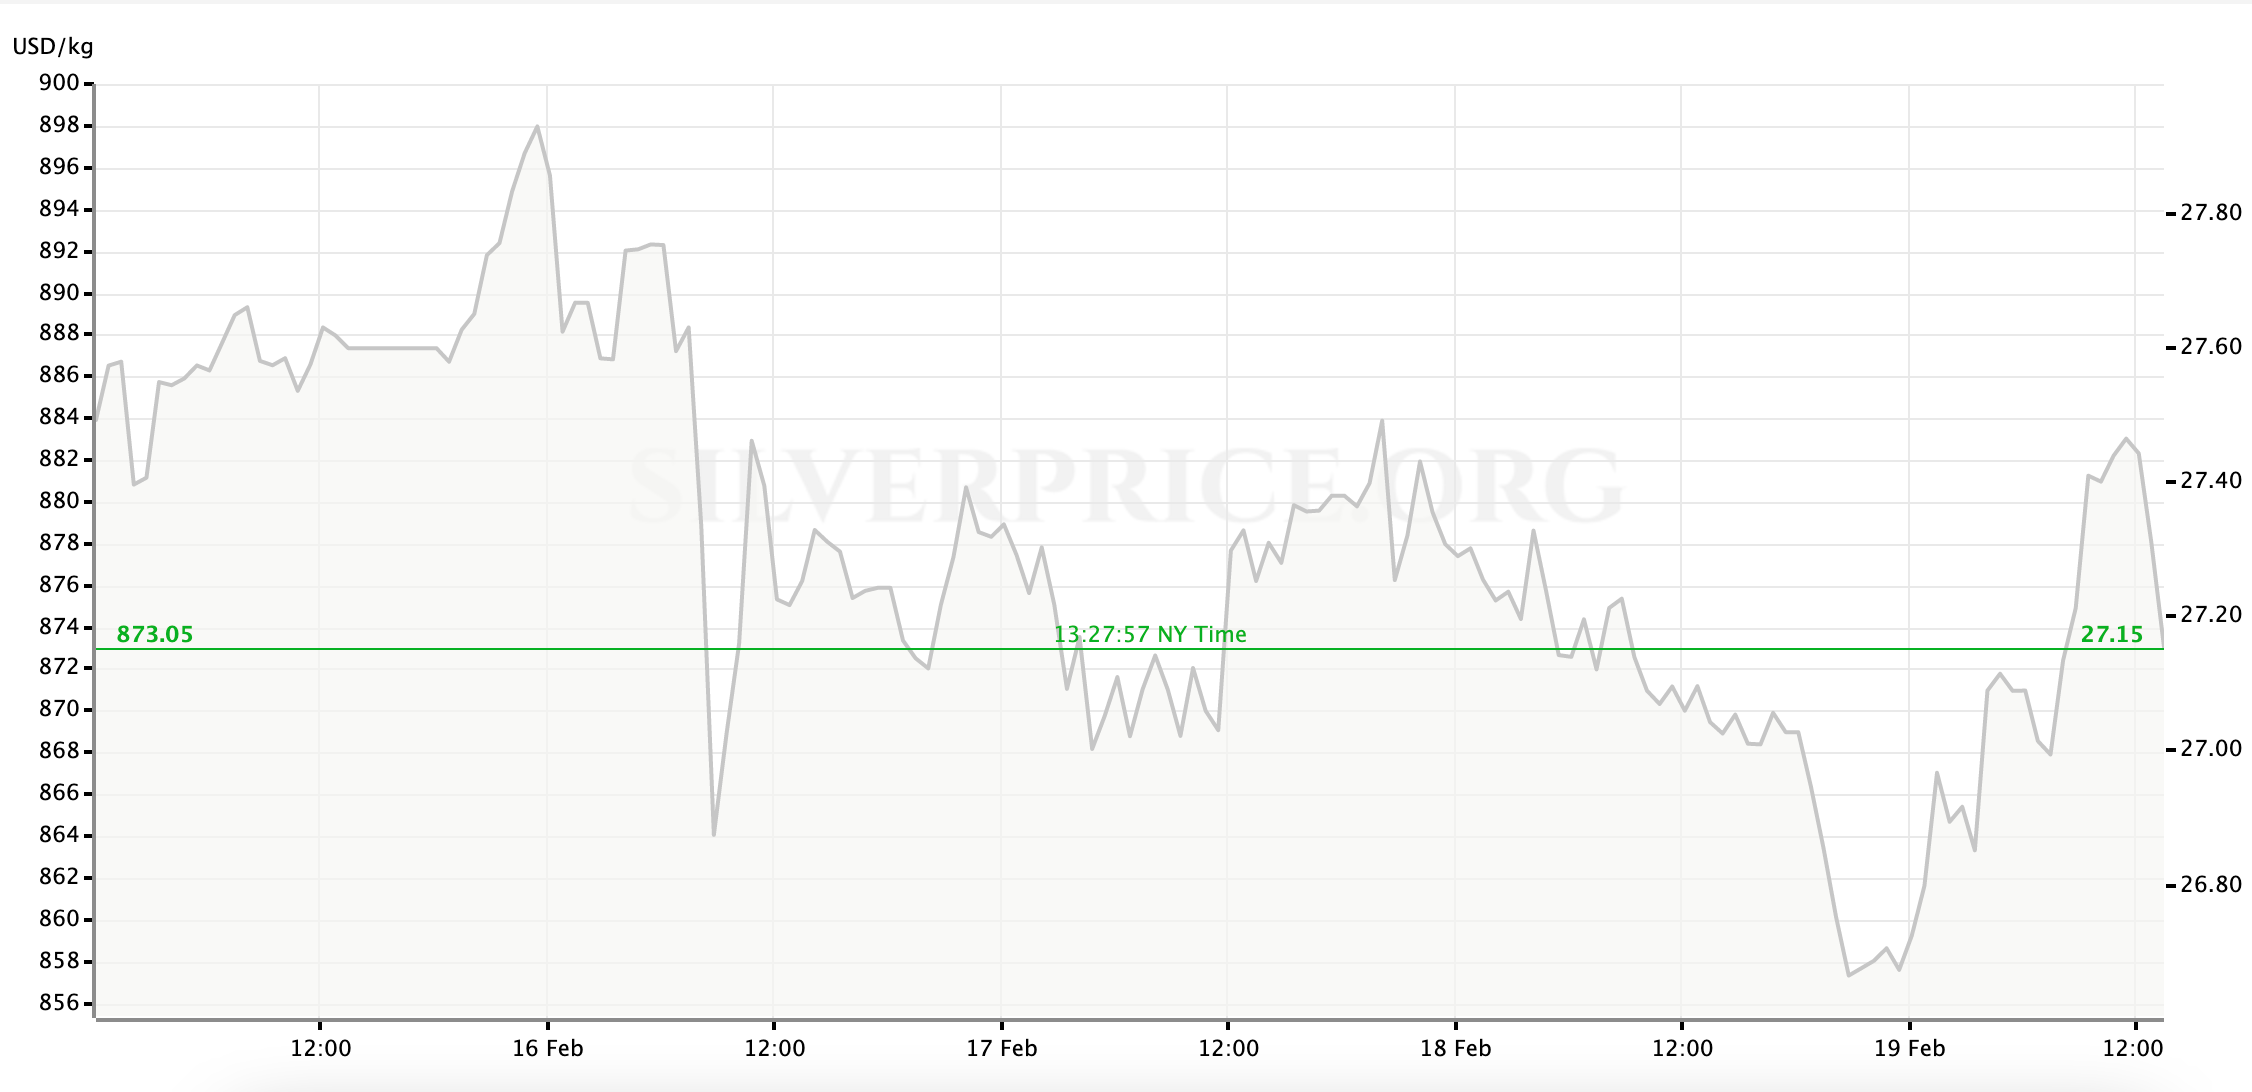
Silver’s broader use case as an industrial commodity in a recovering/growing US economy allowed it to get some separation from gold at various points through the week; but the white metal generally followed the yellow’s pattern lower, notching marks just above $26.50/oz at the low point of Thursday night. As US traders logged on Friday morning, both metals saw a rush of buying. Given the sharpness of the initial climb and the lack of any sudden turns in the investor optimism that has buoyed markets recently, I’m most inclined to point to “bargain buyers” (or possibly even short-term gold shorts closing out for profits) stepping in as the reason for gold (at the time of writing) trading back near $1780 to end the week. With that said, as we expected this week has moved us closer to passage of a massive fiscal stimulus package for the US so there are undoubtedly some traders and managers who will be taking advantage of gold as a suddenly less expensive inflation hedge today and into next week. Silver has taken the path higher as well, again trading well above $27/oz in the spot markets.
Taking a look at the week as a whole, it’s been a rare stretch wherein to name growing risk-appetite across financial markets as the reason for gold’s constant slide is both simple and mostly comprehensive. Although there don’t seem to have been any great steps taken in stimulus package negotiations in Washington this week, the trajectory still seems locked-in for a serious loosening of fiscal policy which has investors the world over building bullish cases for US and global recovery and growth through 2021. Meanwhile, for the first time since maybe December, the numbers detailing American efforts to curtail the winter surge in COVID-19 while accelerating vaccinations all seemed to be moving in the right direction with a measure of stability. There’s simply not much driving investors to spend money on risk-off safety. Gold prices were under especially heavy pressure earlier in the week, when the US Dollar was making steady gains against its trading partners. Those headwinds have eased later in the week as the Greenback’s momentum has been unwinding a bit, and that in turn has opened the door for the mild rally in gold prices that we’re seeing Friday.
Equity Markets Have Remained Calmer but Still Bullish for 2021 Growth; Treasury Yields Have Moved to 1-year Highs on the Same View
Movement in US equity markets and Treasury yields was a little more up-and-down this week. Initially, following the time-tested correlation, stock prices rallied across the board on Tuesday as bonds fell and pushed interest rates considerably higher; The benchmark 10-year note’s yield reached above 1.3% for the first time in over a year.
Stock markets were more uneven on Wednesday—and then considerably lower on Thursday—as Treasury yields initially corrected lower before surging back again and building a stronger line above 1.3%. The sentiment of equity investors seemed to turn on Thursday, from cheering the conditions that have allowed interest rates to head higher, to now fretting about the potential for those higher rates to muddle the US’ economic recovery. Keep these kinds of vacillations in mind next time you think there might be such a thing as “an intelligent market.”
At the end of the week, stocks appear to be closing out the week on the front foot, with Treasury Secretary Janet Yellen’s continued support for increased fiscal stimulus getting a lot of the credit for motivating investors.
US Economic Data are Providing Mixed Signals about the Outlook for Recovery
Of the two economic numbers we were looking out for this week, one came in well above expectations while the other was (at best) and equally disappointing miss.
Wednesday morning’s Retail Sales report printed the third-biggest month-to-month jump on record, marking a spending increase of more than 5% against expectations for a rise of just over 1% in January. The debate over whether American consumers were actually injecting their direct stimulus checks into the economy (rather than mostly saving,) seems settled for now. The immediate market reactions were mixed, and that’s somewhat understandable: While the Retail growth number is a positive sign of a viable US recovery, the strength of it may be used as an argument against the need roll out the very biggest version of the Biden Administration’s coronavirus relief package.
24 hours later, however, the data turned bitter. The weekly report on Initial Jobless Claims was a deep disappointment, counting over 850,000 new unemployment filings in a week where economists were hoping to see a decline closer to 750,000. This was a big, bad miss, as any lasting US economic recovery will depend as much—and most likely more—on a robust jobs market than on volatile retail sales growth. This week’s labor market data paints conditions as far from ‘robust,’ particularly given that, once again, the prior week’s sub-800K number was revised substantially higher and well above 800,000.
Next Up
Next week, focus will remain on the road to fiscal stimulus and the horse-trading it will take to get the money pipe opened by mid-March. We’ll also keep an eye on testimony from Fed Chair Powell who will likely continue pushing for said stimulus; And later in the week we’ll look at how the Fed’s own metrics for consumer inflation in the US matches to last week’s CPI data.
For now, traders, I hope you can get out and safely enjoy your weekend for the next couple of days. After that, I’ll see everyone back here on Monday for our preview of the week ahead.

Gold Price Chart


More articles from John Moncrief


