Home sales rose a solid 6.5% in February compared to the month before, the highest pace in 13 years. Analysts expected gains of just 07%. 5.77 million units were sold, with the market boosted by lower mortgage rates. Rates were lower in part due to market fear surrounding the coronavirus outbreak. However, the sales data was taken before the severe escalation of the pandemic, and the economic impact is likely to negatively impact future sales.
Key Takeaways
- February home sales rose 6.5% to an annual rate of 5.77 million units, a 13-year high.
- The data was taken before the coronavirus outbreak had a chance to put the brakes on homebuying.
- The most recent pace of sales would take 3.1 months to exhaust vs. 3.6 months last February.
Annually, sales rose 7.2% in February, marking an 8-year high in year-over-year home sales. The housing market was on a positive trend as of last month, with lower mortgage rates encouraging new buyers. The existing supply of houses tightened further, with low inventory being an ongoing problem in the housing market.
At the February pace of sales it would take 3.1 months to sell the existing inventory compared to 3.6 months in February 2019. A supply of 6 – 7 months is seen as a healthy balance between supply and demand. Low supply drove home prices higher this year, and the median sales price for an existing home rose 8% in the 12 months through February to an $270,100.
Existing home sales rose 6.5%, jumping from an annualized 5.42 million units in January to 5.77 million units in February, all of that gain from single-family activity. Sales have risen a solid 7.2% over the past 12 months, up from 5.38 million units in February 2019. pic.twitter.com/2OMsU9iJYV
— Chad Moutray (@chadmoutray) March 20, 2020
Home prices rose in all regions, led by gains in the Northeast and South. Home sales fell 4.1% in the Northeast to an annual rate of 700,000, up 2.9% compared to February 2019. The median price in this region rose 8.2% annually to $295,400. Existing home sales in the Midwest rose 0.8% to an annual rate of 1.29 million, up 4% from last year. The median price in this region rose 7.9% annually to $203,700.
Expert Outlook
While the data is upbeat out of context, the global financial situation has changed drastically in the last few weeks due to the escalating coronavirus pandemic. It’s estimated that millions of Americans will lose their jobs in the coming months, with thousands of businesses already shut down across the country to prevent the spread of the virus.
Lawrence Yun, chairman of the National Association of Realtors, commented on the severity of the situation.
“These figures show that housing was on a positive trajectory, but the coronavirus has undoubtedly slowed buyer traffic and it is difficult to predict what short-term effects the pandemic will have on future sales.”
However, the outlook was not all negative.
“For the past couple of months, we have seen the number of buyers grow as more people enter the market,” Yun said. “Once the social-distancing and quarantine measures are relaxed, we should see this temporary pause evaporate, and will have potential buyers return with the same enthusiasm.”
Yun also foresees home prices holding steady despite the financial instability currently underway. “Unlike the stock market, home prices are not expected to drop because of the on-going housing shortage and due to homes getting delisted during this time of crisis,” he said.
Market Reaction
Gold prices have seen strong gains throughout today’s session. Spot gold last traded at $1,492.71/oz, up 0.95% with a high of $1,515.38/oz and a low of $1,463.64/oz. While such strong home sales might typically be bearish for gold prices, the precious metals markets have looked past the headline figures, aware that March sales are likely to paint a very different picture of the housing market.
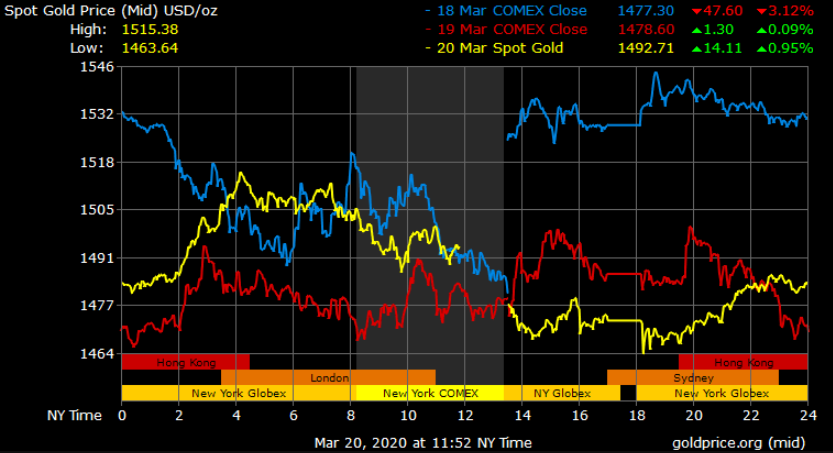

Gold Price Chart


More articles from Conor Maloney


