The service sector grew at a slower rate than expected in September according to the ISM Non-Manufacturing Index which was released on Thursday. The index came in at a reading of 52.6 compared to 55.3 expected by economists surveyed by the Dow Jones. The reading was the lowest pace of growth since August 2016, resulting in a stock market selloff and an uptick in the price of gold.
Key Takeaways
- The ISM Non Manufacturing Index sunk closer to contraction with a reading of 52.6 vs. 55.3 expected.
- The report comes days after the ISM Manufacturing Index which hit a ten-year low and showed the second month of contraction in a row.
- The recent economic data shows the effects of the trade war’s drag on the economy being felt in the wider economy.
Technically speaking, anything above 50 indicates growth in the non-manufacturing survey, which indicates the number of companies expecting to expand their business. However, a reading above 48.6 has generally been in line with economic growth. The sub-expectation result of the survey, coupled with the ten-year low seen in the ISM manufacturing survey released earlier this week, has fueled concerns of worsening economic conditions within the US, and perhaps a recession on the horizon.
New orders dropped to 53.7 in the non-manufacturing survey, 6.6 points below the result in August. Employment dropped from 53.1 to 50.4, and prices rose from 58.2 to 60. Four of the nine components in the survey showed growth, with the majority showing decline. Orders backlogs rose from 49 to 54, re-entering growth territory. New exports rose 1.5 points to 52.
Exports have taken a major hit in multiple industries due to the escalating tariffs put in place by the US and Chinese trade war which has now raged for well over a year. Business investment has also suffered in the uncertain economic climate, and there are concerns that the negative impact will spill out into the labor market and consumer spending, both of which are tightly linked and serve as the driving force behind the US economy. While the economy is now in its 11th year of expansion, the longest such period in the nation’s history, domestic recessionary indicators along with a global economic slowdown now pose a threat to its ongoing growth.
BREAKING! #ISM Non-Manufacturing plummets too! Down to 52.6 from 56.4, way below expectations. pic.twitter.com/4A77odln0w
— jeroen blokland (@jsblokland) October 3, 2019
Expert Outlook
The ISM has cited fears regarding trade war tariffs along with labor resources and general economic indicators as the cause behind the reduced growth last month.
“Net, net, look out below is what purchasing managers from services industries are shouting at the markets as the fears of recession continue to mount,” said Chris Rupkey, chief financial economist at MUFG. “Stock investors don’t like that the doom and gloom in the manufacturing sector is starting to infect the bigger part of the economy that employs millions of workers in services industries including health care, retailing, business administration, accounting, computer services on and on.”
A survey respondent citing the influence of the trade war stated that “while Chinese tariffs are understandable, they are impacting our supply chain decisions. We are actively pursuing alternate sources for our China-based production. At this point, we have not passed on tariff costs to our customers, but we are evaluating all options.”
Market Reaction
Gold prices have seen a significant increase as a direct result of the survey’s release. Spot gold last traded at $1,511.93/oz, up 0.73% with a high of $1,517.62/oz and a low of $1,496.60/oz. The services sector is a massive component of the US economy, and negative reports in such turbulent economic times tend to increase risk-aversion in the precious metals market and create increased demand for gold as a safe-haven asset, which in this case has coincided with a selloff in the stock market following the release of the ISM report.
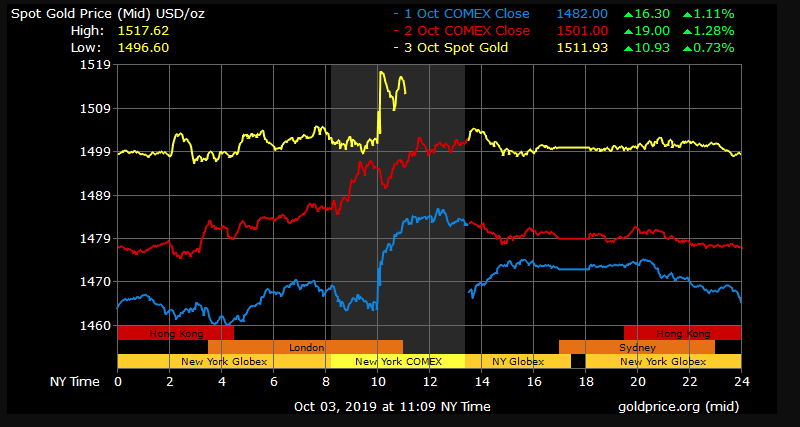

Gold Price Chart


More articles from Conor Maloney


