November saw no change in producer price inflation with reduced costs for services offsetting gains in other areas like gasoline and food. While consumer prices rose in November, producer price inflation was unexpectedly soft. Prices saw no growth following a 0.4% gain the month before.
Key Takeaways
- US producer prices saw no change in November vs. 0.2% gain expected and 0.4% gain in October.
- Annually, prices rose 1.1% according to the producer price index (PPI), matching October’s rise.
- The annual growth is the lowest since October 2016.
Recent producer price inflation indicates the slowest annual growth in about three years. While gasoline and food prices rose in November, the cost of services fell. PPI was predicted to rise 0.2% on a monthly basis and 1.2% annually. Excluding the volatile components of food, energy, and trade services, PPI also saw no change last month after rising 0.1% in October. Core-PPI rose 1.3% annually in November, the smallest gain since September 2016, following a 1.5% annual increase the month before.
Wholesale energy prices rose 0.6% after 2.8% gain in October. Gasoline prices rose 2.3% in November and 7.3% the month before. The cost of goods rose 0.3% last month, down from 0.7% gain in October. Wholesale food prices rose 1.1% in November and 1.3% in October, and core goods rose 0.2% last month after no change the month before.
These gains were offset by a drop in services of 0.3%, the steepest drop since February 2017, following a 0.3% gain in October. Trade service prices, which account for two-thirds of the drop in service prices last month, fell 0.6%. Healthcare fell 0.2% in November after gaining 0.8% the month before.
PPI was unchanged in Nov after a strong Oct. Food and energy goods grew the strongest at 1.1% and 0.6%. Services PPI fell -0.3% with trade services down -0.6%. Annual PPI grew 1.1% with core PPI ex food and energy down to 1.3%. https://t.co/BnKCM8bE5q pic.twitter.com/DnkVOpb5E5
— MTS Insights (@MTSInsights) December 12, 2019
Inflation
A report on Wednesday showed strong gains in consumer prices for November. The core personal consumption expenditures (PCE) price index rose 1.6% annually in October, falling short of its 2% target for 2019. November PCE data will be published next week.
The mixed-to-tame inflation data strengthens the case for the Federal Reserve to keep interest rates steady after implementing multiple rate cuts throughout the year. November saw 266,000 jobs added to the economy with unemployment near historic lows at 3.5%, indicating ongoing economic growth.
Market Reaction
Gold prices have seen steady gains following the release of the PPI data. Spot gold last traded at $1,467.03/oz, up 0.30% with a high of $1,486.11/oz and a low of $1,465.96/oz. Gold prices may have been boosted by recent statements made by ECB president Christine Lagarde who said that the European Central Bank would continue its highly accommodative monetary policy, commenting “Let’s face it; it’s weak growth. Economic growth is not at its potential”.
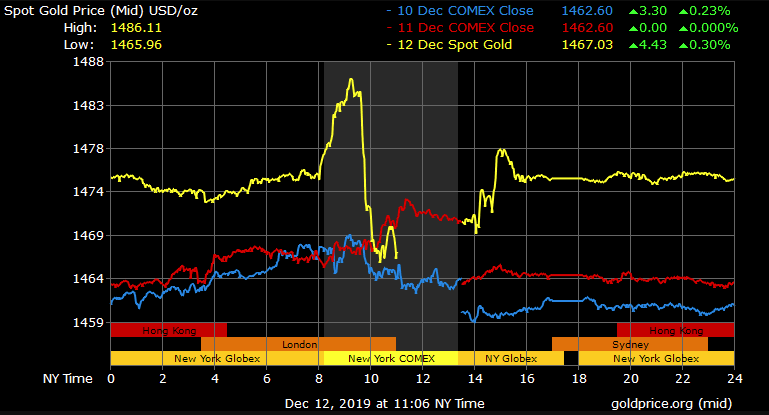

Gold Price Chart


More articles from Conor Maloney


