Manufacturing conditions saw major improvements in June, according to the latest survey from the Philadelphia Federal Reserve. The Philly Fed’s manufacturing index smashed expectations of a negative -23.0 reading and saw increases in general activity, new orders, and shipments, all of which have returned to positive territory. Employment remained negative, but saw the second month of growth in a row, and the six-month outlook forecasts further growth.
Key Takeaways
- The index for general activity rose from -43.1 to 27.5 vs. -23.0 expected in June, with 46% of firms reporting increases.
- New orders rose 42 points to 16.7 and shipments rose 56 points to 25.3.
- The June report marks the first positive reading in general activity since February, right before the onset of the coronavirus pandemic in the US.
- While the headline figure is positive, production capacity fell a median 10%, indicating underlying problems.
Manufacturing conditions have risen in the Philadelphia region as the economy continues to gradually reopen nationwide. New orders and shipments rose 42 points and 56 points respectively, bringing each index back into positive territory. The index for employment remained negative, indicating contraction, but rose 11 points in June. 72% of firms reported steady employment levels, with 16% reporting decreases vs. just 12% reporting increases. 46% of firms reported increased general activity in June vs. just 15% in May.
Philadelphia Fed Manufacturing Survey rebounds over 60 pts to 27.5. New orders and shipments see steep rise to positive territory, up 41 pts and 55 pts. Employment remains negative as most firms report no change in number of employees or size of workweek. https://t.co/qqM1R8eJiw pic.twitter.com/ORzddsGp6A
— MTS Insights (@MTSInsights) June 18, 2020
The prices paid index rose 8 points to 11.1 overall. 16% of firms reported increased input prices, with 5% reporting decreases and the majority seeing no change. The index for prices received rose 14 points to 11, the first positive reading since the pandemic struck the US in March.
Meanwhile, capacity utilization came in at between 70% and 80%, 10% lower than the median rate seen at this time last year. 78% of firms reported decreased production growth vs. just 13% reporting increased production growth.
Future Activity
The future general activity index rose 17 points, hitting the highest level in almost 30 years. 75% of firms forecast improved activity over the next six months vs. 9% predicting negatively impacted activity. Future capital spending rose 11 points to 26.3, in line with last year’s figures. The index for future shipments rose 19 points, while future new orders rose 13 points. The future employment index rose 13 points to 29.6, and one-third of firms predicted improved employment in the next six months.
Market Reaction
Gold prices have faced selling pressure following the release of the manufacturing report, as well as the week’s jobless claims figures. Spot gold last traded at $1,722.91/oz, down -0.28% with a high of $1,736.44/oz and a low of $1,718.90/oz. Jobless claims fell over 50,000 last week, continuing to tick downward from the peak seen in March.
While gold prices are mostly reacting to the positive headline figure in today’s manufacturing news, some economists have pointed out that the special question about production capacity is the real figure to keep an eye on. The 10% median reduction in production capacity may paint a poor picture of manufacturing overall.
“This special question gives a better sense of where the industry is overall,” said Adam Button, senior currency strategist at Forexlive.com
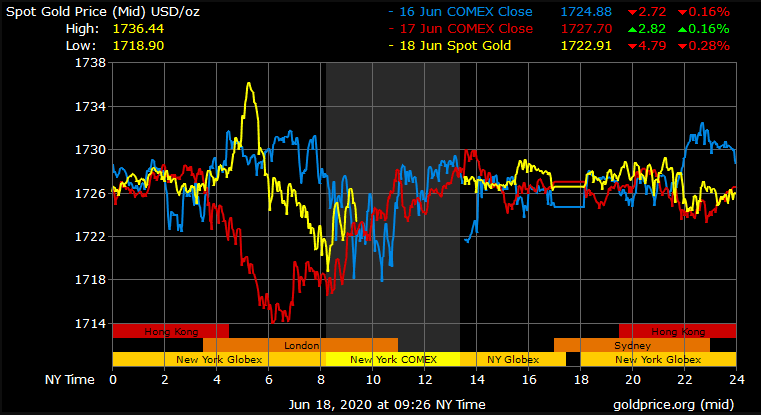

Gold Price Chart


More articles from Conor Maloney


