Retail sales in the US rose for the third month in a row last December, gaining 0.3% as expected. November figures were revised upward to 0.3%. The increase is reportedly due to an increase in household goods purchases, which offset declines in other areas.
Key Takeaways
- US retail sales came in at 0.3% as expected vs. 0.3% in November (revised upward).
- Annually, sales came in at 5.8% in the 12 months through December.
- Household goods purchases drove the increase despite weak vehicle sales.
Retail sales continue to show robust activity in the US with the third consecutive monthly increase reported on Thursday by the Commerce Department. US consumer activity accounts for two-thirds of the entire US economy, and the latest data looks promising in terms of sustaining an ongoing economic expansion. Excluding the volatile components of vehicles, gasoline, building materials, and food services, retail sales saw a 0.5% increase last month following a downwardly revised 0.1% drop the month before. These core sales tend to correlate closely with the consumer economy aspect of GDP estimates.
Auto sales dropped 1.3% in December, the largest drop since January, and following a 1.5% rise in November. Rising gasoline prices saw a 2.8% increase in sales at service stations. Online and mail-order sales saw a 0.2% increase last month after no change the month before. Sales at electronics and appliance stores saw a 0.6% jump last month, and material stores saw a 1.4% increase. Clothing stores sold 1.6% more in December, and furniture stores saw a modest 0.1% increase. Restaurants and bars reported 0.2% growth in sales, and sales at hobby, book, and musical instrument stores saw a 0.9% increase.
BREAKING! US retail sales rose 0.3% in December, ex autos and gas +0.5%, more than expected. YoY retail sales up a whopping 5.8% after last year's December slump. pic.twitter.com/1ESVvSnVdV
— jeroen blokland (@jsblokland) January 16, 2020
Consumer Spending and Economic Expansion
Major brick-and-mortar retailers reported decreased shopping activity over the holiday period compared to last year. However, this is likely due to corresponding growth in the e-commerce sector. While a report last week indicated deceleration in hiring for December as well as a drop in wage growth, the labor market remains in relatively strong health. This, in turn, supports US consumer spending which accounts for the bulk of US economic activity and has helped the economy to expand continuously for 11 years.
Consumer spending rose 3.2% annually in Q3 2019, and is believed to have dropped to approximately 2.5% for Q4. Overall, Q3 saw a 2.1% increase in GDP. Q4 estimates look more promising, currently topping off at about 2.5%, although this is partially due to the impact of reduced imports on the US trade deficit.
Market Reaction
Gold prices have seen mild selling pressure following the joint release of three separate economic reports today. Spot gold last traded at $1,551.46/oz, up 0.04% with a high of $1,558.16/oz and a low of $1,551.80/oz. Along with the healthy retail sales, reports came out today of increased activity in manufacturing from the Philadelphia Federal Reserve, and initial jobless claims are also down from last week. All in all, the data makes for an upbeat economic outlook, weakening the use case for gold in the short-term.
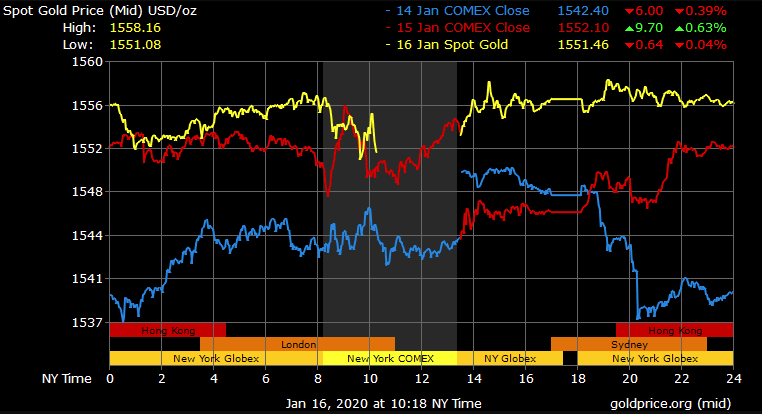

Gold Price Chart


More articles from Conor Maloney


