Growth in employment costs has risen significantly on an annual basis, with the Q4 data indicating the highest growth since 2008 compared to Q4 2017. The Q4 2018 reading was actually slightly below expectations on a quarterly basis, with expectations of 0.8% quarterly growth compared to the actual figure of 0.7% compared to Q3. The quarterly data indicates that inflation pressures are mild despite the strong state of the labor market.
Key Takeaways
- The employment cost index measured by the Federal Reserve rose 0.7% from October-December compared to Q3 according to Labor Department data.
- The increase was below the median estimate of 0.8% growth.
- Wage and salary growth saw a greater decline in growth, rising 0.6% compared to 0.9% in Q3.
- The annual increase was more impressive, with a reading of 2.9% bringing the index to an 11-year high.
Employers have been offering increasingly competitive packages to retain workers in a tight labor market with an ongoing shortage of skilled labors, but the data indicates that the compensation has not risen in all areas equally.
Private sector workers bore the brunt of the deceleration in wage growth with a 0.6% increase in wages. However, on a monthly basis, things may be picking up - growth in average hourly earnings, a monthly measure of private-sector wages, recently rose above 3% for the first time since the latest economic expansion began.
Having said that, the employment-cost index has continued to grow, with an annual increase in Q4 of 2.9% compared to the figure from a year earlier. While the quarterly increase was below expectations, the annual increase is the highest since 2008.
Indicating weak to mild inflation pressures, the data supports the decision the Federal Reserve made this week to hold off on raising interest rates in the face of rising economic risks worldwide, with a recent Reuters poll indicating that the likelihood of a recession has increased.
Policymakers yesterday used the term “muted inflation pressures” to describe the situation, and are making good so far on their promise to take a patient and flexible approach to interest rates following four rate hikes in 2018.
Wages and salaries for civilian workers rose 3.1% from a year before, hitting an 11-year high. Private workers also saw a 3.1% increase which is the same as the prior quarter.
Compensation costs up 0.7% Sept 2018 to Dec 2018 and up 2.9% over the year https://t.co/PnBpNoRn72 #EmploymentCosts #BLSdata
— BLS-Labor Statistics (@BLS_gov) January 31, 2019
Market Reaction
Gold is holding very strong gains today although may have ticked downward slightly following the labor market data, which is admittedly mixed. The annual growth is very strong at an 11-year high, although that growth was expected – the fact that quarterly growth was below expectations indicates tame inflation pressure, which can often create selling pressure for gold.
Initial jobless claims today showed that initial jobless claims have risen to the highest point since September 2017, likely due to the recently-ended partial government shutdown which was the longest in history and affected 800,000 federal workers, and it’s possible that this is positively impacting the price of gold which is up 1.07% and trading at $1,323.94/oz with a high of $1,326.10/oz and a low of $1,309.55/oz.
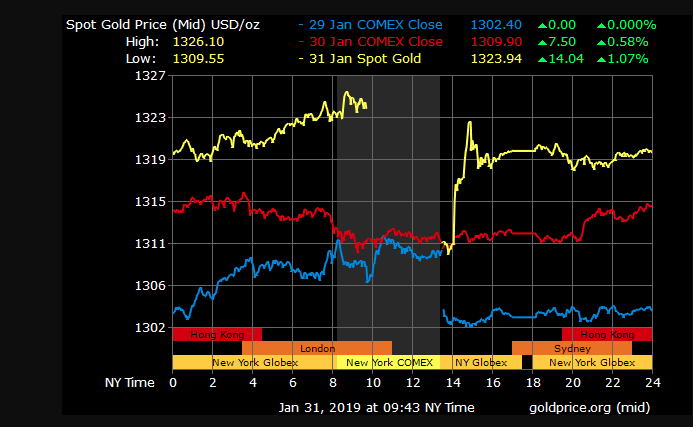

Gold Price Chart


More articles from Conor Maloney


