Home prices in June rose 3.1% on an annual basis, according to the S&P CoreLogic Case-Shiller national home price index. The figure is down from the 3.3% gain seen in May, which in turn was down from the month prior. US home prices have now cooled for 15 months in a row.
Key Takeaways
- The 10-city composite rose 1.8%, down from 2.2% in May, and the 20-city composite rose 2.1% annually, down from 2.4
- Home prices are still growing, but growth has slowed compared to the last few years.
- Some analysts view the downward trend as a natural levelling off to the price spikes that came before.
The highest annual gains of the 20-city composite were in Phoenix, Las Vegas, and Tampa respectively, all cities which have seen consistent growth despite the slowdown. Phoenix home prices rose 5.8% annually in June, Las Vegas homes rose 5.5%, and Tampa homes saw a 4.7% increase.
6 cities out of the 20 reported higher annual increases in May compared to the month prior – the only city to have lower prices than in June 2018 was Seattle. Home prices are now at well over a year of reduced growth, and nearing the slowest pace of growth in seven years.
Second Opinion
Another reading of the housing market by the Federal Housing Finance Agency, or FHFA, reported a 5% increase in home prices in Q2 2019 compared to Q2 2018. The FHFA reading indicates the fifth consecutive quarterly decline in home price gains.
However, the reading also states that things may turn around soon.
It’s likely that the drop in mortgage rates, as well as recently implemented interest rate cuts, will stimulate some renewed growth in home prices, although the extent of that remains to be seen. The average rate for a 30-year fixed mortgage has dropped an entire percentage point compared to last year, theoretically increasing affordability of homes which, in turn, should drive up prices as a response.
S&P Corelogic Case-Shiller Index is out this morning. Topline: housing market cool down reaches 15th straight month, U.S. home price growth falls to 3.1%. Falling mortgage rates not yet boosting housing demand. pic.twitter.com/tm8VVbvrwz
— Ralph B. McLaughlin (@HousingRalph) August 27, 2019
Expert Outlook
Lynn Fisher, senior economic advisor at FHFA, said “We expect some positive effect of the mortgage interest rate decline on housing demand as well as home price appreciation given that rates have fallen a full percentage point since the end of 2018 to below 4% in August. This should lead to a longer summer buying season and potentially a higher rate of appreciation on a seasonally adjusted basis than would have previously been expected in the third quarter.”
“Home price gains continue to trend down, but may be levelling off to a sustainable level,” said Philip Murphy, managing director and global head of Index Governance at S&P Dow Jones Indices in a release. “Fewer cities (12) experienced lower YOY price gains than in May (13).
“The U.S. National Home Price NSA Index YOY price change in June 2019 of 3.1% is exactly half of what it was in June 2018,” added Murphy. “While housing has clearly cooled off from 2018, home price gains in most cities remain positive in low single digits. Therefore, it is likely that current rates of change will generally be sustained barring an economic downturn.”
Market Reaction
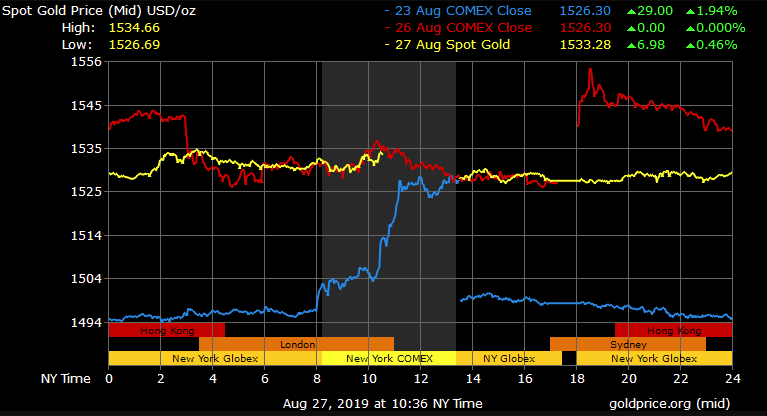
Gold prices have risen following the latest reports of the downward trend in the housing market. Spot gold last traded at $1,533.28/oz, up 0.46% with a high of $1,534.66/oz and a low of $1,526.69/oz.
The upward trend in gold is likely a safe-haven response triggered by the housing market data as well as a weaker US dollar and ongoing US-China trade uncertainty which has been felt today throughout the financial markets.
"It's clear that the main focus is on the U.S.-China developments. Reports from China on the trade front indicate we are nowhere near any change in the current standoff on trade," Saxo Bank commodity strategist Ole Hansen said.
"And with the growth numbers in Germany pointing to a recession, there's not much of an excuse to sell gold if you are holding any, keeping the market more or less unchanged even though we had a toning down of the confrontational tone on trade," Hansen said.

Gold Price Chart


More articles from Conor Maloney


