Despite expectations of a significant decline, sales of new homes in the US reached the highest point since November 2017 in March, likely a result of the market leeway created by lower mortgage rates and the slowdown in home price gains compared to wage gains.
Key Takeaways
- New home sales rose by 4.5% in March to a seasonally adjusted rate of 692,000 units, the highest since November 2017.
- This marks the third month in a row of increased new home sales. February data was revised down to 662,000 from 667,000.
- March sales greatly defied expectations of up to a -5% drop in sales following increases the prior two months.
The latest Commerce Department report on new home sales shows strong activity throughout Q1 2019, despite expectations of a trend reversal in March. While new home sales account for a just 11.7% of the housing market, the pace of sales is encouraging and most likely driven by lower mortgage rates and home prices.
New home sales tend to be volatile on a monthly basis, although consistent quarterly activity is more indicative of an overall trend. Land shortages, interest rates, rising cost of mid-trade war materials, and rising labor prices driven by a tight job market all had a negative impact on affordability throughout 2018, but many of those factors have been significantly reduced.
The median house price has dropped 9.7% to $302,700 when compared to March 2018, the lowest level since February 2017 after rising interest rates drove up prices. Mortgage rates have dropped 80 basis points since last November after the Fed signaled that no rate hikes would be introduced in 2019, suspending its three-year monetary tightening program.
Report Data
The South accounted for the bulk of sales, and saw an increase of 3.6% in March, the highest level since July 2007. Midwestern sales saw a major 17.6% increase, and sales in the West climbed 6.7%. The Northeast, on the other hand, reported a significant drop of -22.2% in new home sales.
Last month, 344,000 new homes were on the market, down -0.3% from the month before. The current inventory would be cleared in 6 months if sold at the same pace seen in March, down from 6.3 months in February. 62% of houses sold last month were either under or pending construction.
We are seeing is normalization in the housing market. New home sales are rising (up 4 of last 5 months) while existing sales are flattening out. Getting back to "steady state" on this chart implies that there is room for new home sales to continue climbing. pic.twitter.com/Tl8ZxSeKjR
— Renaissance Macro (@RenMacLLC) April 23, 2019
Housing Market Still Struggling Overall
Existing home sales, which account for the bulk of the market, are still struggling due to a lack of lower-priced houses available for sale. The short supply has driven up the median price and kept many potential buyers out of the market for the time being.
Land and labor shortages persist, and investment in homebuilding saw the biggest drop since 2010 in 2018, contracting -0.3%.
Expert Outlook
“While the jump in sales is a sign that demand remains resilient, the weakness in single-family building permits suggests that homebuilders may not be expecting this trend to continue,” said Katherine Judge, senior economist at CIBC World Markets. “Admittedly, this is a volatile series, but if demand continues to hold up, homebuilding activity could pick up later in the year.”
Market Reaction
Gold has seen a modest reaction to the news, largely under pressure from momentum seen in the value of the US dollar. Spot gold last traded at $1,268.96/oz, down -0.36% with a high of $1,276.49/oz and a low of $1,266.77/oz. June Comex Futures are down -0.70% and trading at $1,270.06/oz.
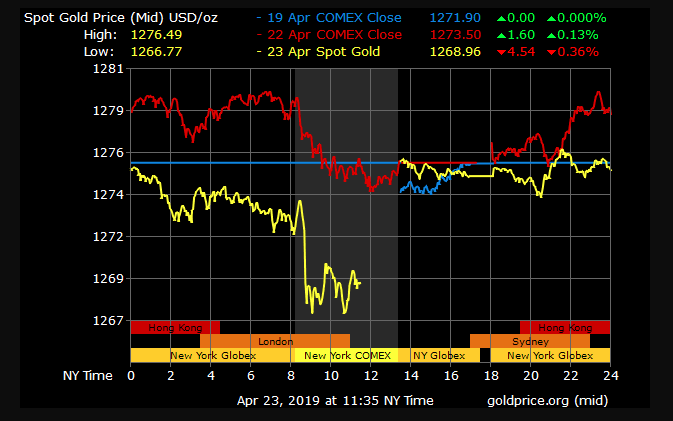

Gold Price Chart


More articles from Conor Maloney


