Pending home sales dropped 1% in February, declining 4.9% year over year. The pending home sales index dropped to 101.9 in February, down from January’s figure of 103.2. Housing activity varies region to region with the South and West showing increases in contract signings while the Northeast and Midwest have shown declines. Mortgage rates are dropping fast as the Fed has removed rate hikes from the forward guidance. Gold failed to break out of 1325 despite the Fed removing all rate hikes from forward guidance.
Pending Home Sales Data
According to the National Association of Realtors, pending home sales dropped 1% in February, declining 4.9% from last year’s figures. National Association of Realtors chief economist Lawrence Yun said, “In January, pending contracts were up close to 5 percent, so this month’s 1 percent drop is not a significant concern.”
The pending home sales index, which is based on contract signings, dropped to 101.9 in February, down from January’s figure of 103.2. Activity in the home market varies between different regions with the south and west showing increases in contract signings while the Northeast and Midwest showing minimal declines. Pending sales in the Northeast declined 0.8 percent month to month down 2.6 percent vs one year ago. In the Midwest, sales fell 7.2 percent since January and 6.1 percent since last year. Sales in the South were up 1.7 percent monthly and down 2.9 percent annually. Sales in the West increased 0.5 percent monthly and were 9.6 percent lower than last year. Sales of homes priced below $100,000 fell 11% since last year mostly due to a lack of inventory. Sales of homes priced between $100,000 and $250,000, represent the bulk of the market, were flat year over year.
Changes in Mortgage Rates
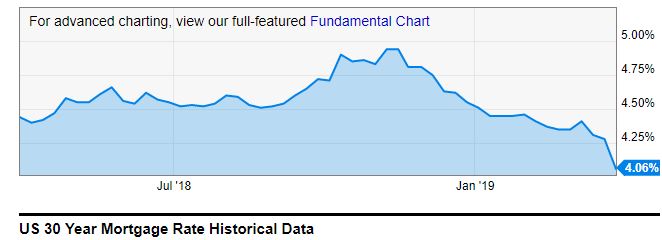
Pending home sales dropped 1% despite homebuyers having the benefit of lower mortgage rates. Back in November of 2018 the average 30-year fixed mortgage was just about 5%. In December 30-year mortgage rates began to fall with January’s figure coming in just above 4.6 percent. At the start of February rates were down to just over 4.4 percent.
The Federal Reserve has removed all rate hikes from forward guidance and the market has started to price in a rate cut for the end of 2019. This has caused mortgage rates to plummet with a current 30-year mortgage sitting just above 4 percent. Nationwide’s Chief Economist David Berson feels optimistic about the condition of the housing market. Berson explains that “There are good reasons to expect housing activity to expand in coming months, as mortgage rates have dropped to the lowest levels in more than a year, house price gains have slowed (helping affordability), the job market remains solid (with wages accelerating), and household formations are running well-above trend.”
Gold Price Action
Gold’s correlation to the dollar has been weak at best as it failed to break the 1325 handle earlier this week. Gold has mostly focused on rates and the fed in the past few weeks. With the market starting to price in a rate cut for the end of 2019, gold looks like a good hedge on possible economic turmoil.
Historically, gold trades with momentum, when gold trades higher it gets more news coverage and more interest among investors. When that momentum wanes, we usually get a strong mean reversion, as we saw when we failed to break 1325 and dropped back to a low of about 1290 in less than 48 hours. Keep an eye out for Fed signaling rate cuts. Rate cuts are usually a catalyst for higher gold prices since the Fed lowering rates indicates an economy that needs support.

Gold Price Chart


More articles from Ryan Page


