GoldPrice.

WHERE THE WORLD CHECKS THE GOLD PRICE

Holdings

Calculators

Current Gold Holdings

$

Future Gold Price

Current Silver Holdings

$

Future Silver Price

Save the values of the calculator to a cookie on your computer.

Note: Please wait 60 seconds for updates to the calculators to apply.

Display the values of the calculator in page header for quick reference.

The Holdings Calculator permits you to calculate the current value of your gold and silver.

  • Enter a number Amount in the left text field.
  • Select Ounce, Gram or Kilogram for the weight.
  • Select a Currency. NOTE: You must select a currency for gold first, even if you don't enter a value for gold holdings. If you wish to select a currency other than USD for the Silver holdings calculator.

The current price per unit of weight and currency will be displayed on the right. The Current Value for the amount entered is shown.

Optionally enter number amounts for Purchase Price and/or Future Value per unit of weight chosen.

The Current and Future Gain/Loss will be calculated.

Totals for Gold and Silver holdings including the ratio percent of gold versus silver will be calculated.

The spot price of Gold per Troy Ounce and the date and time of the price is shown below the calculator.

If your browser is configured to accept Cookies you will see a button at the bottom of the Holdings Calculator.

Pressing the button will place a cookie on your machine containing the information you entered into the Holdings Calculator.

When you return to goldprice.org the cookie will be retrieved from your machine and the values placed into the calculator.

A range of other useful gold and silver calculators can be found on our Calculators page

Gold Price Calculators

Economists forecasted jobless claims to decrease to 220,000. The figure was a slight miss as jobless claims reported a seasonally adjusted 228,000 for the week ending May 4th.  The number of people still receiving benefits after the first week increased 13,000 to 1.68 million for the week ending April 27th. April added 263,000 jobs with the unemployment rate dropping to 3.6%.

Jobs Data

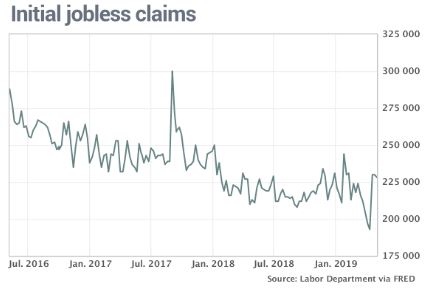
The number of Americans filing for state unemployment benefits decreased 2,000 to a seasonally adjusted 228,000 for the week ending May 4th.  Jobless claims decreasing less than expected can be some indication that the labor market is slowing up. The more important figure to watch is the four-week moving average of initial jobless claims which increased 7,750 to 220,250. The four-week moving average decreases the intra-week volatility that can be caused by holidays and school spring breaks.

The number of people receiving benefits after an initial week of aid increased 13,000 to 1.68 million for the week ending April 27th. The four-week moving average fell 8,000 to 1.67 million.

In April 263,000 jobs were created and the unemployment rate dropped to a near 50 year low of 3.6% (reported last week).

Gold and Dollar Price Action

The equity markets have had a shaky week with the Dow Jones Industrial Average dropping nearly 800 points. Gold has been relatively calm during this week. Some would expect gold to be up significantly more given the signs of cracks appearing in the equity markets. Jobs data had little effect on Gold, the Dollar and Equity markets as jobs data was only a slight miss. Keep an eye on the Fed as the Fed should be one of the biggest catalysts for gold to breakout.
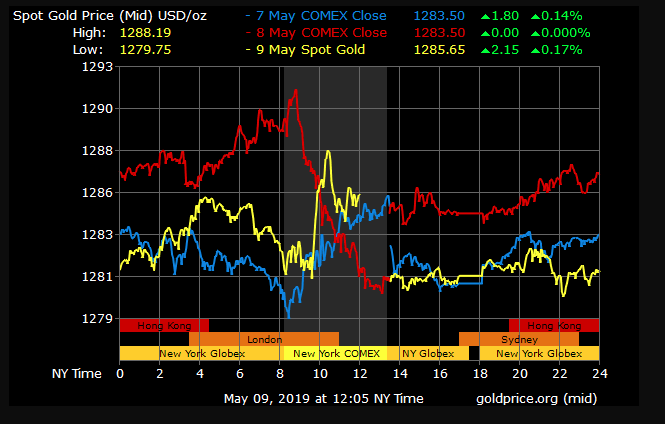
gold price

Ryan Page

Ryan Page has worked for 3 years as a commodities derivative’s trader. He has been building models to analyze global macro data and evaluate risk for more than 5 years.

Ryan has been trading since he was 14 years old. He enjoys playing mid to high stakes poker, with immense experience studying and applying game theory.