Home Sales jumped 4.6% in January according to a measure used by the National Association of Realtors. Sales were still down 2.3% compared to last year.
Key Takeaways
- Home sales are reported to have increased by 4.6% according to NAR.
- January has been the 13th consecutive month of year-over-year declines in home sales with a 2.3% annual drop.
- The rebound was predicted in various forms by many economists.
January home sales rebounded on a monthly basis although sales are still down annually for the 13th month in a row. NAR’s pending home sales index tracks home contract signings and saw a reading of 103.2 in January after hitting what was almost a 5-year low the month before, with many economists predicting the subsequent recovery. The end of the partial government shutdown was also predicted as being a contributing factor to the rebound.
Sales rose in all US regions, with the South leading the charge at a 8.9% increase, followed by the Midwest at 2.8%, the Northeast at 1.6%, and the West at a modest 0.3%. The index helps predict upcoming existing home sales. These sales are, however, predicted to be 1.1% lower in 2019 than last year even with the current data.
The housing market has been the subject of multiple dour reports in recent months, and although the recent uptick was predicted, the housing market is by no means out of the woods.
Expert Outlook
“We have argued recently that existing home sales would soon have to hit bottom, and this report tentatively suggests that the worst now is over; the 50 [basis points] drop in mortgage rates since late last summer is helping,” said Ian Shepherdson, chief economist for Pantheon Macro.
”February existing home sales should now rebound handily and with new home sales likely to head higher too, given the rising trend in mortgage demand, the gloomy housing narrative in markets and the media is set to change quite dramatically over the next few months. The market is not rolling over, and it is not a harbinger of recession in the broader economy.”
Pending Home Sales increased 4.6% to 103.2 in January, up from 98.7 in December. #NARPHS pic.twitter.com/6zhwSANmCw
— NAR Research (@NAR_Research) February 27, 2019
Market Reaction
Gold entered a downward trend earlier in today’s session with some volatility directly following the rather mixed housing data. Ultimately gold is still trading down -0.33% at $1,320.70/oz with a high of $1,329.88/oz and a low of $1,319.86/oz. Positive housing market data can sometimes be correlated with downward pressure on spot gold prices, but today’s report of a rebound also comes with the fact that sales have been down annually for over a year now. For the time being the $1,330.00/oz line of resistance is holding firm.
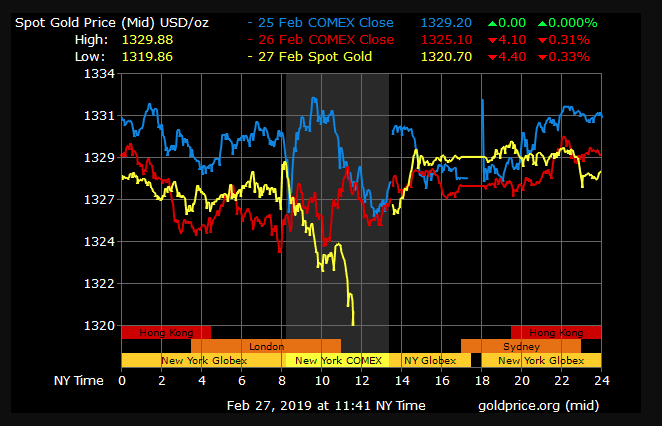

Gold Price Chart


More articles from Conor Maloney


