Happy Friday, traders. Welcome to our weekly market wrap and look at the gold markets. We are once again ending a week that has been dominated by the markets’ (suddenly strong) concern about the true economic cost of the Covid-19 epidemic.
BREAKING: The Dow falls more than 300 points to cap the worst week for Wall Street since the financial crisis. https://t.co/Ddv6uV60Fd pic.twitter.com/5quoXtsffx
— CNBC Now (@CNBCnow) February 28, 2020
In turn that would have seemed unlikely on Monday, gold prices have followed other major assets down and to the right amid a global correction driven by fear and risk aversion. Rather than dig through a range of economic data that had little-to-no impact on the yellow metal’s spot pricing this week, we’re going to discuss the factors that have stripped more than $100/oz in value from gold even as the financial world is digging into a firmly risk-off posture.
So, what kind of week has it been?
Gold Prices’ Burst Higher on Monday was a False Start, Overextension
Global markets have been on edge and under pressure from start to finish this week, and the Sunday night/Monday morning open to trading was dominated by a market-wide scramble to digest the weekend’s flow of worrying news around the Covid-19 virus epidemic. Of key concern is the reality that while the rate of infection (at least by some metrics) may be slowing inside China, the virus’ spread has entered a new stage in which it is accelerating outside of the initial hot zone. Italy and Iran have seen the biggest increases and are the centers of the infection for their respective regions.
There are elevated risks to these two centers of infection: in Iran, global health authorities may have reason to distrust the Iranian governments’ ability to contain the disease as well as its transparency (or lack thereof); in Italy, a high number of infections have been reported in Milan which has just finished hosting visitors from around the world for its Fashion Week so authorities will have an extra difficult task in tracking the movement of travelers out of Milan’s airport to the rest of the world.
These new and darkening worries were the key drivers that began this week’s massive sell-off in risk markets and remain in the driver’s seat even as we wrap up Friday’s session.
The effect of what I can only describe as an overconfident global equity market finally waking up to the true economic risk posed by Covid-19 on Monday was a global rout in stocks that began with a massive rush to safety in the Asian and European trading sessions and ended with the Dow’s biggest drop in two years. The majority of the commodities complex was also crushed lower, with oil prices leading the way in free fall, as investors and indeed entire industries recalibrated their outlook for raw material demand around the world.
BREAKING: The Dow falls more than 300 points to cap the worst week for Wall Street since the financial crisis. https://t.co/Ddv6uV60Fd pic.twitter.com/5quoXtsffx
— CNBC Now (@CNBCnow) February 28, 2020
While silver prices struggled to find as a great a deal of momentum due to their greater exposure to weakness in industrial commodities, analysts were calling gold prices “the winner” in Monday’s massacre as the yellow metal traded near $1660/oz on Monday after weakening from highs in the $1690s. Despite the $30 sell-off from the top, it looked as if another week of worry would provide gold the momentum to continue on from multi-year highs.
After Monday, as the Global Equity Rout Continued, a Key Correlation for Gold Broke Down
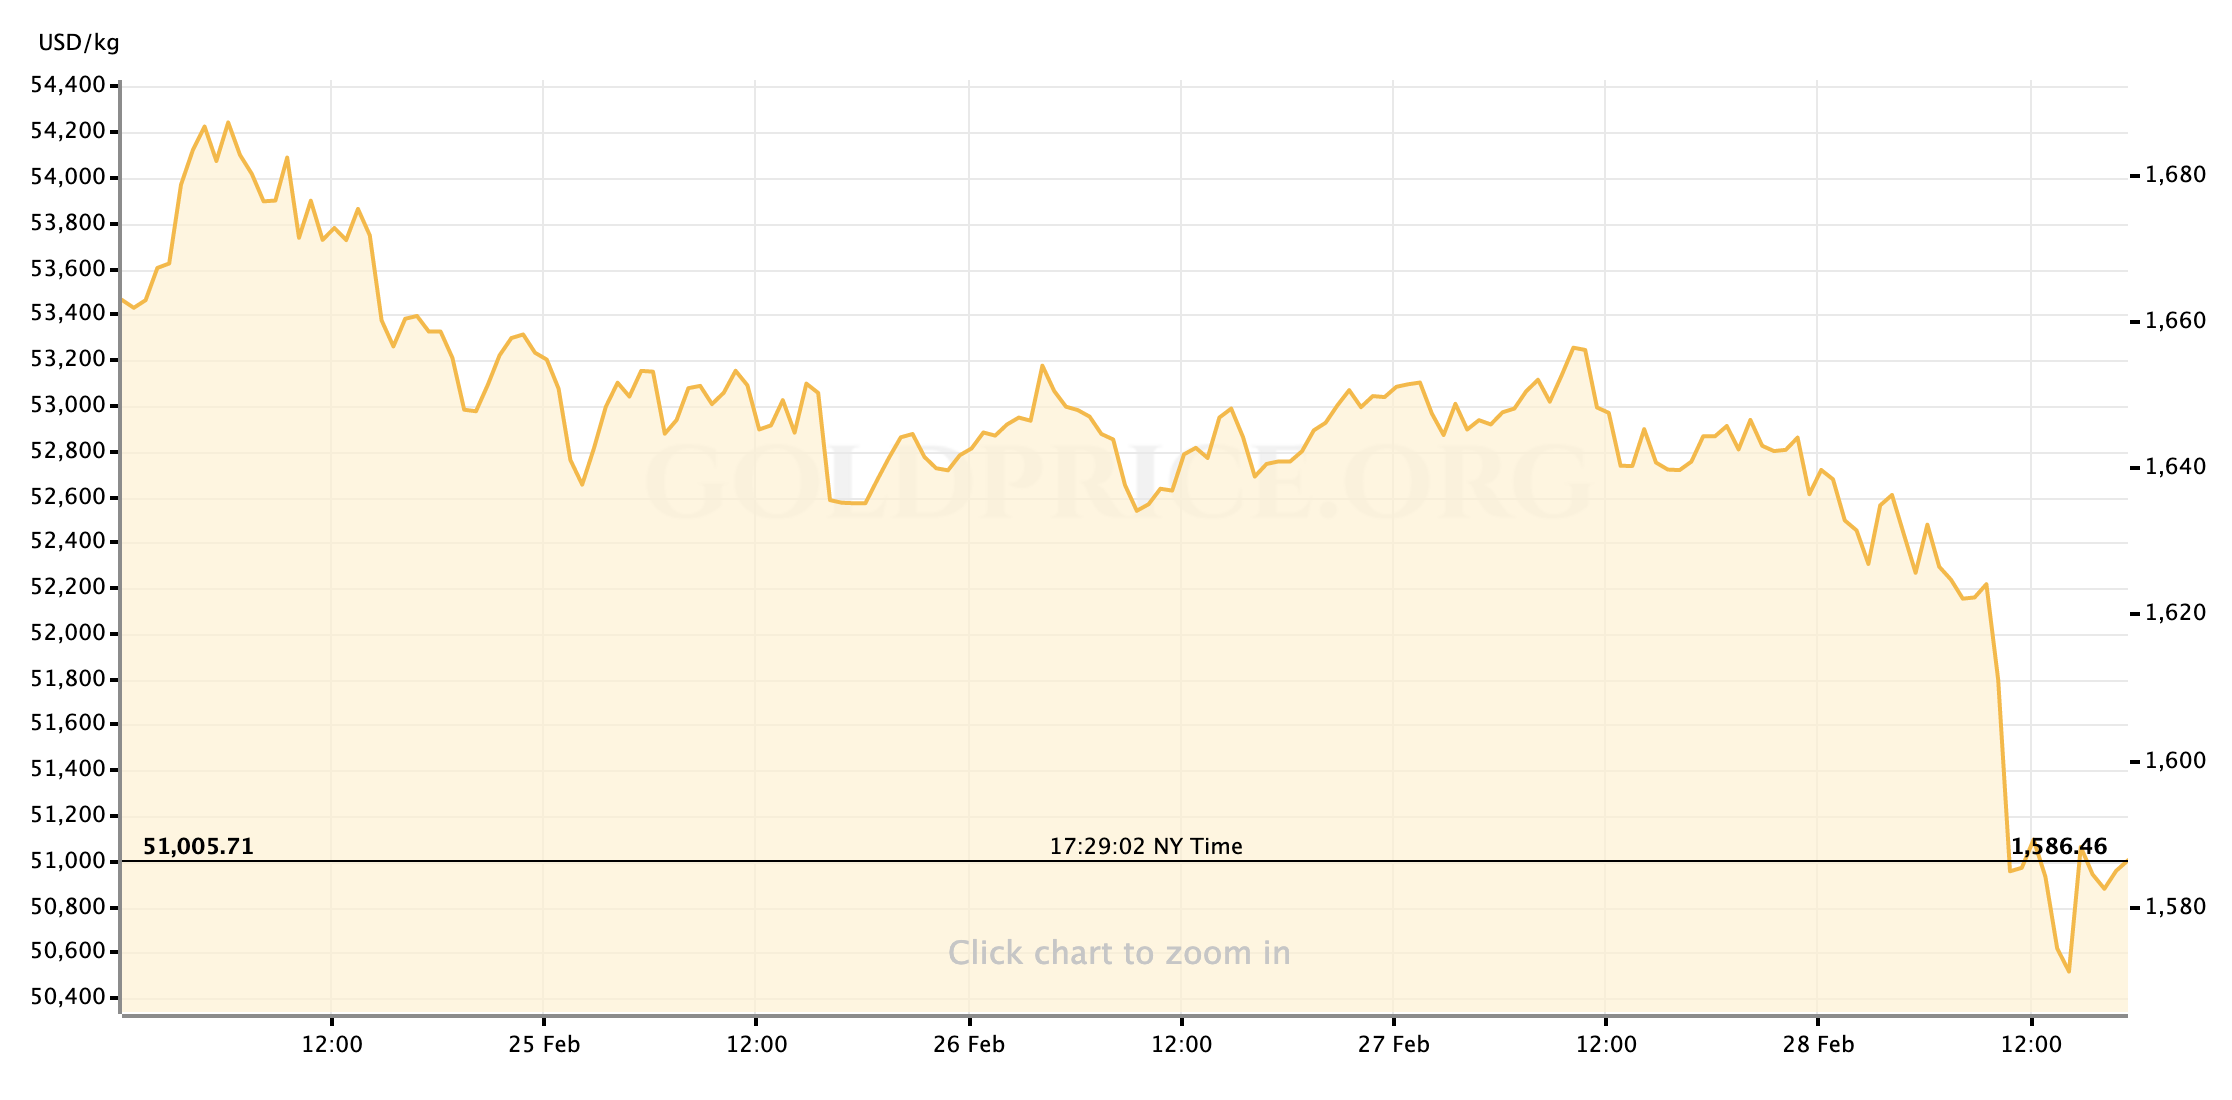
Whether you read your daily market coverage at the start or the end of each day, it has followed the same pattern all week: more cases reported outside of China (centered in Italy, Iran, and South Korea,) more major firms revising their Q1 projections lower if not scrapping them all together, and deeper lows each day in the world’s major stock markets. But from the global market re-open on Monday evening, gold’s upward momentum seemed to have petered out. The yellow metal’s price charts for Monday through Thursday evening show a regular cycle of strong bursts of selling that pushed prices lower, and slow, plodding recoveries to the $1645-50/oz range. It became clear that one of the most common inverse relationships in gold trading—risk markets selling off matched to gold prices trading higher—has left the market.
Selling Pressure Has Overtaken Gold’s Support on Friday, Driving Prices Well Below $1600/oz
The move in gold that began Thursday evening around the global market re-open and reached full extension (for now) mid-day Friday is what I believe experts call “the whole entire bottom dropping out.” (I hope you’ll forgive the rare use of technical jargon.) Opening Friday’s book of business around $1645/oz, the yellow metal trended lower through the overnight hours and cratered in the US session, reaching its nadir just below $1570—more than $100/oz off of Sunday night’s peak. It has been gold’s deepest drop in over five years. Because I don’t think you come here each week for something like “gold is lower because everything is getting sold,” (although, broadly, that’s correct,) I want to take a quick look at the three main pressures that have pressured gold and finally broke its rally today. They are: concerns about near- to medium-term demand for gold among the rest of the commodities class; the markets’ preference for US Treasury bills as a safe haven hedge; and the global need for cash to spend.
Weaker Demand Outlook for Gold Mean Weaker Support for Elevated Pricing
This is the one we’ve talked about the most since the spread of Covid-19 first began crimping economic activity. The steadily worsening outlook for China is hitting gold prices from two angles. Primarily, because China is the single largest consumer of raw materials in the world, a slowdown in its economy implies a drastic drop in need for those commodities—even if in practice it will affect the demand for some commodities more than others, the whole asset class is being drawn lower. Gold demand also takes a hit because the Chinese market is so important for makers of luxury goods: with their production likely to slow in Q1 they will also decrease overall demand for gold.
With lower perceived level of demand for gold through Q1 and probably Q2 of 2020, there is much less fundamental support for gold prices to remain at their recently elevated levels.
US Treasuries Have Been Positioned as Best Hedge vs. Volatility, Further Reducing Demand for Gold
As more acute concerns driven by a global epidemic have damaged the demand for physical gold, a long-gestating shift in financial markets has also weakened the safe-haven demand for buying gold as an investment. Whether it’s a positive or negative change, in 2020 asset prices and balance sheets around the world have ballooned to a level where “asset price volatility” (in other words, plummeting stocks) poses a very real threat to the global economy as a whole. As such, the pervasive view among investors is that there is a “central bank put” in place. That is: at a certain point, to support the economy central banks will be compelled to step in and support the economy by cutting interest rates. Sparing ourselves the bond math, this means that owning US notes and bonds—even at the historically low yields that they’ve reached this week—is an iron-clad safety hedge. Put best by Bloomberg’s Joe Weisenthal, who’s coverage of gold this week has been really helpful to forming my own outlook:
Treasuries are up, gold is down. When people are panicking, there's just no substitute for that sweet, sweet US government guarantee.
— Joe Weisenthal (@TheStalwart) February 28, 2020
Of course, this is a factor that—if other headwinds are removed—could also support gold pricing when/if we see actual rate cuts. It’s important to note, then, that the Fed’s Jerome Powell opened the door to just such a move this afternoon.
The Primacy of USD is Forcing Investors to Sell Anything—Including Gold—to Get It
Part of the utility of gold as an investment, through a chain of value transfer, is the belief in some corners that gold will be the currency of the wasteland after the end of the world. As I’m unable to prove a negative, that remains a viable outlook. But for the time being, while financial markets as we’ve known them still operate, the Dollar is king. The Greenback’s position as the global reserve currency means that the world’s debts and other liabilities are denominated in USD. So when things like big margin payments need to be made—say, when the final trading day of the week (and month) coincides with a stock market rout that has wiped nearly $3 billion in value off of the board—investors will sell whatever they own that holds value in order to get cash. With global risk assets in the tank, the best Dollar value on many balance sheets by a mile today is gold. This situation has been amplified, I believe, by the US Dollar having remained on the uptrend in recent weeks even as gold surged. This isn’t an unprecedented trend, of course: gold prices were also suppressed for most of 2008.
Next Up
Gold spot prices have closed out this volatile week at $1585/oz in the spot markets, and we turn out attention to next week. As far as the data calendar goes, the only points of interest look to be another set of US manufacturing and service sector PMIs scattered through the week, and the February’s Jobs Report on Friday. Covid-19 will continue to dominant the markets’ attention; specifically, I think we’ll be drawn to watching for signs of emergency action by the Federal Reserve (or other major central banks) to more proactively support the global economy amid the health crisis.
For now, do your best to stay healthy and enjoy your weekend, traders. I’ll see you all back here on Monday for our breakdown of the week ahead.

Gold Price Chart


More articles from John Moncrief


